Auto Tune and Bayesian Search
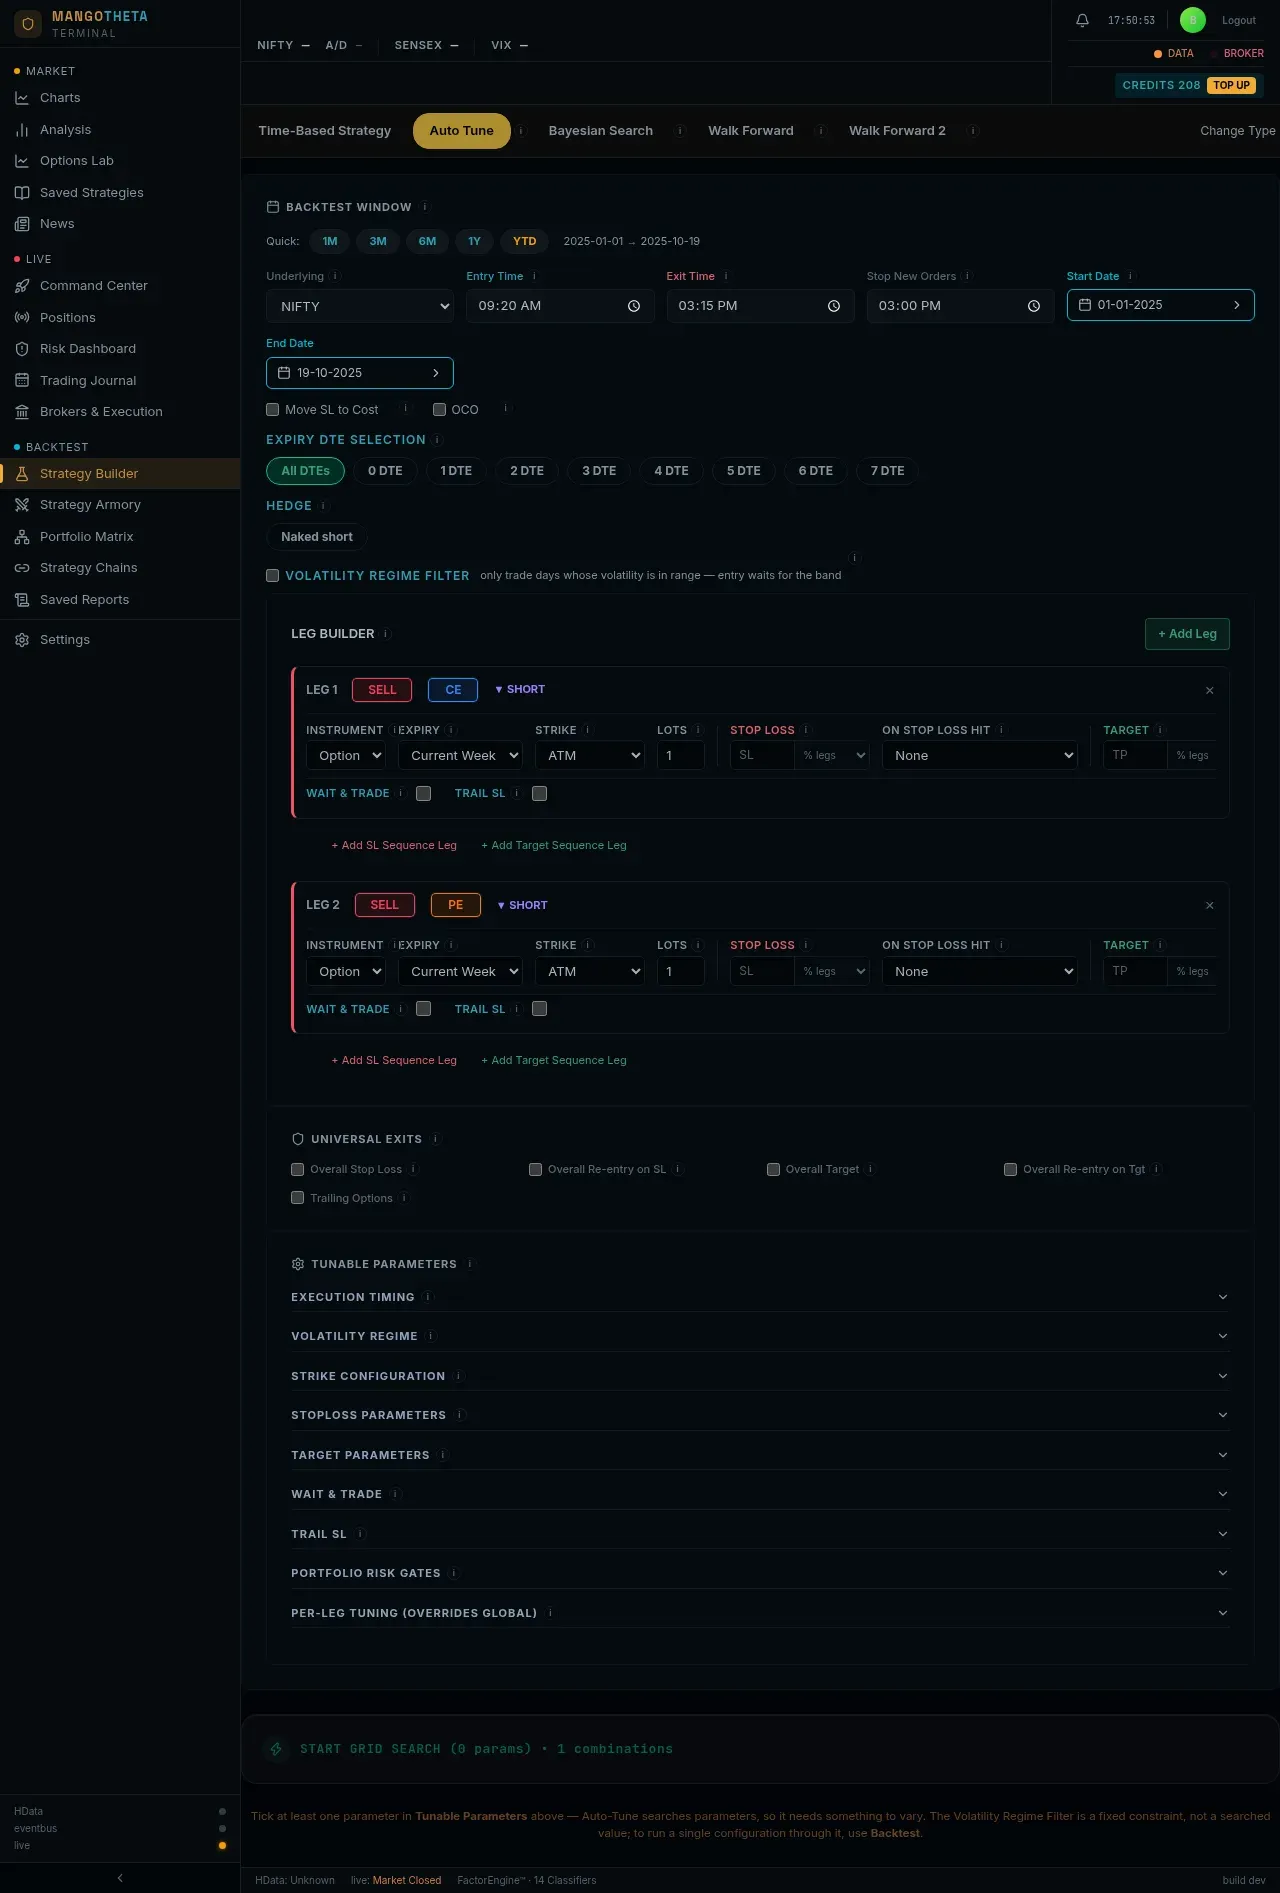
Auto Tune runs your strategy many times with different values for the settings you choose, for example stop losses of 20%, 30%, 40% and 50%, and ranks the results. Bayesian Search does the same but tries a limited number of values, picking each next one from what has worked so far.
Where to find it: Strategy Builder → build a strategy → the Auto Tune or Bayesian Search tab at the top.
Which one to use
Section titled “Which one to use”| Tab | How it searches | Use it when |
|---|---|---|
| Auto Tune | Tries every combination of the values you tick. | The number of combinations is reasonable. You see the whole picture, including whether the best value has good neighbours. |
| Bayesian Search | Tries 300 combinations on your dates by default (set Trials, from 10 to 2,000), choosing where to look next from the results so far. It then takes up to 20 of the best, picked so they differ from each other, and measures them on a later out-of-sample window it never searched. Only those are in its ranking. | Ticking everything you want would make too many combinations. |
The tab is filled from your form
Section titled “The tab is filled from your form”The tuning tab starts from the strategy on the builder form: the same legs, rules and exits. You only choose which values to vary. If you change the form afterwards, a note asks you to Re-sync or Keep my values (see the Strategy Builder page).
Backtest Window
Section titled “Backtest Window”| Item | What it does |
|---|---|
| Quick: 1M 3M 6M 1Y YTD | Set the date range in one click. |
| Underlying, Entry Time, Exit Time, Stop New Orders | Copied from your form; you can change them here for this run. |
| Start Date / End Date | The past days every combination is tested on. |
| OOS Start / OOS End (Bayesian Search) | A later window kept back from the search. The winner is tested on it afterwards. It must start after the End Date; the app refuses to launch if they overlap, and warns if the window is too short to mean anything. |
| Move SL to Cost, Expiry DTE Selection | As on the builder form. OCO and Hedge sit on each leg’s card, as there. (A template with no legs keeps a Hedge switch here instead.) |
| Neighbourhood check | Tick it and its options open below: how many of the top results to probe, and how far a neighbour may be (± minutes, % points, points, strikes). Each probe is one more backtest, priced before you launch. |
| Volatility Regime Filter | Trade only while volatility is inside a band you choose. This fixes the band; it does not search over bands. See below. |
| Strategy Conditions | A read-only view of your entry and exit rules, so you can check the run is about the strategy you mean. |
Volatility Regime Filter
Section titled “Volatility Regime Filter”Tick Volatility Regime Filter to test the strategy only when the market’s volatility is in a range you choose. Pick how volatility is measured:
| Mode | You set | What is compared |
|---|---|---|
| VIX Range | VIX Min (points) and VIX Max (points) | India VIX. |
| VIX Bucket | One or more of Low VIX (under 13), Mid VIX (13 to 18), High VIX (18 and above) | India VIX. |
| ATM IV Range | ATM IV Min (%) and ATM IV Max (%) | Implied volatility of the at-the-money options. |
| IV Percentile | IV Percentile Min and Max (0 to 100) | Today’s ATM IV against the last 252 trading days: the share of days that were lower. It is measured on the 09:19 minute, so it is known from 09:20; an earlier Entry Time waits until then. Days without a full year of history are left out. Backtest and Auto Tune only: Paper and Live cannot use it yet. |
How it changes the entry: the strategy still starts watching at its Entry Time, but it enters at the start of the first minute whose previous minute closed inside the band. An order at 09:20 can only know the 09:19 close, so that is what it reads, the same as a live order. It keeps waiting until 15 minutes before the square-off, or until Latest Entry (optional) if you set one. If the band is never reached that day, there is no trade. Once a trade is open, leaving the band does not close it.
Click Check Matched Days before you launch. It counts, for each chosen underlying, the trading days in your dates that fall in the band, for example NIFTY — 88 of 247 trading days match. Only the days the run can trade count: with Expiry DTE Selection set to 0 DTE, only 0 DTE days are counted. It also says whether that is enough, splits the days by DTE, and shows the median ATM IV of each DTE in your dates.
Example: you think your short straddle works only in calm markets. Choose VIX Range, 11 to 14, and click Check Matched Days: 96 of 247 days match. Launch: every combination now enters only when VIX is between 11 and 14. Compare the result with a run without the filter.
Tunable Parameters
Section titled “Tunable Parameters”Tick a parameter to vary it, then set Min, Max and Step. Anything not ticked stays at the value from your form.
| Group | What you can vary |
|---|---|
| Execution Timing | Entry Time, Exit Time, No New Orders After. |
| Volatility Regime | Which volatility band to trade in, as a searched value. See Searching volatility bands. |
| Strike Configuration | Global Strike Mode and its value, for every leg at once. |
| Stoploss Parameters | SL Mode (the unit) and On SL Hit are fixed choices, not searched. You can vary SL Value, the re-entry counts and waits. Under Combined SL (a stop on the whole position): Combined SL Mode (Rs (₹), % Pct or Pts Points) and On Combined SL Hit (none, re_entry, re_execute) are fixed; Combined SL Value can be varied. |
| Target Parameters | The same for targets: Target Value can be varied, and Combined Target has Combined Target Mode, On Combined Target Hit and Combined Target Value. On Target Hit is fixed too. |
| Wait & Trade | W&T Mode (fixed) and Wait & Trade Value. |
| Trail SL | Trail Move Value and Trail Lock/Trail By. |
| Portfolio Risk Gates | Max Loss Per Day, Max Profit Per Day, Square Off All On Any Leg SL. |
| Per-Leg Tuning (Overrides Global) | Vary one leg’s settings on their own, for example a hedge leg’s strike. |
| Indicator Parameters | (Indicator strategies) the numbers inside your rules: periods, thresholds. |
Example: tick SL Value with Min 20, Max 40, Step 10 (three values: 20, 30, 40), and Combined SL Value in Rs (₹) with Min 3,000, Max 6,000, Step 1,000 (four values). Auto Tune runs 3 × 4 = 12 combinations: every leg stop paired with every whole-position stop.
How many combinations
Section titled “How many combinations”Each ticked parameter gives a number of values; the app multiplies them together.
Example 1: SL Value from 20 to 50, Step 10 → 20, 30, 40, 50 = 4 runs.
Example 2: add Entry Time from 09:20 to 09:30, Step 10 minutes → 09:20, 09:30 = 2 values. 4 × 2 = 8 runs.
The launch button shows the count, for example START GRID SEARCH (2 params) • 8 combinations. Every extra parameter multiplies the total, so add them one at a time.
Searching volatility bands
Section titled “Searching volatility bands”Under Volatility Regime, tick Volatility Band to make the band itself a searched value. Choose ATM IV % or IV Percentile, then Min, Max and Step: each step is one band. Tick include unfiltered baseline to add a row with no filter at all, for comparison.
Example: ATM IV %, Min 5, Max 60, Step 5 makes eleven bands: 5–10, 10–15, … 55–60. Each combination of your other parameters is tested in each band.
In the results, two columns matter for band rows:
- Band days: how many days the band actually matched. Rows under 60 days are marked THIN: too few to trust. A tag such as D0 72% means most of the band’s days were expiry days, so its result may be about the expiry day rather than about volatility.
- Band vs random days: open a rank and click it to compare the band with random sets of days of the same size and expiry mix taken from the unfiltered baseline. It shows Beats, the share of those random sets the band beat, for example 97%, with Survives from 95% on if the band has at least 60 days, plus how much of the edge comes from the expiry mix and how much from the band itself (DTE-led when the expiry mix explains more). It needs the baseline row, so tick include unfiltered baseline before you launch; otherwise it says No baseline.
Example: the 10–15 band tops the table with ₹62,000. Click Band vs random days: 58%. More than four in ten random sets of days did as well, so the band’s lead is probably luck. Measured on NIFTY data, a meaningless filter beats the unfiltered result about half the time, which is why this check exists.
Launch, wait, cancel
Section titled “Launch, wait, cancel”Click the START button. The bar shows progress (Testing combinations…). Cancel stops the run.
If some combinations fail, a red note says how many, and those rows show FAILED with the reason. They are not scores of zero.
Every finished run is normally saved automatically to Saved Reports. The save button then reads Saved ✓ · Open in Saved Reports: click it to open the saved copy.
Reading the results
Section titled “Reading the results”There is one report for every mode (grid, Bayesian Search, Walk Forward and Walk Forward 2). Saved Reports opens the same report. It reads top to bottom in the same order as every Lion report, and a result of a different mode only changes which parts apply.
At the top you also get:
- the dates the results were measured on (re-run a winner on exactly these dates to get the same P&L);
- Ask AI: type a question about the results, for example Which setting has the smallest drawdown for at least ₹50,000 profit?, and click Analyze Results. The answer is written by an AI model from these results; check it against the table;
- the save button (see Launch, wait, cancel);
- a yellow Volatility regime filter was ON line when you used the filter, with the band. Results from a filtered run are not comparable with an unfiltered run’s.
Portfolio tabs
Section titled “Portfolio tabs”Optimal Portfolio, DTE Breakdown and Entry Time Leaders are three tabs under the table:
- Optimal Portfolio builds baskets from the best rows. Top strategies combined takes the top settings and adds their daily results together. Non-correlated combined takes good settings that win and lose on different days, so the basket holds more independent bets. Each basket shows its combined Net PnL, Win%, Max DD, RecF (recovery factor) and more. The small tabs (Win%, Expectancy Ratio, Recovery Factor, Low Drawdown, Ulcer Index, Profit Factor, Combined P&L, and Hedge when there are hedged rows) choose which measure picks the basket. Top 5, Top 10 or Top 20 sets its size.
- DTE Breakdown shows the best setting for each days-to-expiry bucket separately.
- Entry Time Leaders shows the best setting for each entry time.
Example: Top strategies combined holds five settings that differ only in stop loss: they win and lose on the same days, so its Max DD is five times one setting’s. Non-correlated combined mixes a 09:20 entry with a 13:00 entry and different strikes: similar profit, a much smaller drawdown. That second basket is the one to consider.
Capital allocation
Section titled “Capital allocation”Under a basket, choose a mindset. It decides the order of the settings:
- AGGRESSIVE: the highest net P&L × profit factor first;
- CONSERVATIVE: the best recovery factor with the smallest drawdown first;
- CONSISTENT: the best win rate first.
The first gets 40% of the capital, the next 40% of what is left, and so on; the last two share the rest equally. The capital is the Deployable capital figure (₹1 crore unless you change it), kept in your browser.
Example: ₹10,00,000 over four settings: 40% = ₹4,00,000, then 40% of ₹6,00,000 = ₹2,40,000, then the last two share ₹3,60,000: ₹1,80,000 each.
Under the split, a table compares Equal split, Aggressive, Conservative and Consistent on the same basket: P&L, Max DD and RMDD, each measured on the members’ summed daily P&L. A setting given a share w of the capital runs at w × (number of settings) times its own measured size, so the equal split is the 1× baseline. The figures are before brokerage and slippage. A report that kept no daily P&L for a member shows no table.
Save and Deploy on a basket save its settings as one portfolio, or save and deploy it, in Paper mode.
The report, top to bottom
Section titled “The report, top to bottom”Flags, the answer, the six headline figures, then the parts. Explanations sit behind each (i); the page itself shows figures.
Flags (only when they apply): Legacy metrics (saved before the 24 Sep 2026 metrics convention), Hedged · 2 wings, Stopped at 120 of 300 trials (a Bayesian Search that hit its time limit) and Baskets picked with hindsight (a Bayesian report’s baskets are chosen on the out-of-sample results they show).
The answer is one line. Its (i) lists the figures behind it for this run.
| Run | The answer reads | Read from |
|---|---|---|
| Grid, Bayesian | Real edge · #1 holds, Real edge · #1 partly luck, Real edge · #1 neighbours untested, Likely luck, or All profitable · luck untested | Deflated Sharpe (is the best result above what the luckiest of this many tries would show?), Probability of overfit (does the in-sample #1 hold on other days?) and #1’s robustness |
| Walk Forward | Held out of sample, Held in part out of sample or Did not hold out of sample | The share of windows that made money out of sample, and walk-forward efficiency |
| Walk Forward 2 | Picks carried over, Picking helped in part or Picking not proven | Rank agreement in each window, the Top Losers control, and how much of hindsight’s result the baskets kept |
Example: a 120-setting NIFTY grid (sell CE + sell PE, Jan to Oct 2025) reads Real edge · #1 partly luck. Deflated Sharpe is 99.6%: the family has an edge. Probability of overfit is 70%: in 49 of 70 splits the in-sample #1 fell to the bottom half on the other days. #1 is moderate; #3 is robust with 44% less drawdown and a higher RMDD (9.25 vs 8.59). #3 is the safer pick.
The six headline figures are P&L, Max drawdown, RMDD, Win rate, Profit factor and Exp.R, the same six as the basket tabs and the single backtest report. For a grid or Bayesian run they are #1’s. When #1 is not robust and a lower rank is, that rank’s figure sits under each one. For Walk Forward they are the joined out-of-sample result; for Walk Forward 2, the default basket out of sample.
Then the parts, in this order. Each one appears only when the run has data for it.
| Part | What it shows |
|---|---|
| Walk-Forward 2 | (Walk Forward 2 only) Every window’s frozen basket, measured on the month after. See Walk Forward. |
| Walk-Forward survival | (Walk Forward only) See Walk Forward. |
| How to combine | Overall, DTE and Entry time tabs: the basket each metric picks, its six figures and its settings. |
| Is the edge real? | One figure per line. Left: Deflated Sharpe, Best Sharpe vs luck hurdle, Probability of overfit, Neighbourhood of #1 (ROBUST, MODERATE, FRAGILE or NOT LOCAL PEAK, with its stability) and one line per tuned parameter (LOW, MEDIUM or HIGH sensitivity, with the weaker neighbour’s score against #1’s). Right: 1,000 random re-orderings of the selected basket’s days: Monte Carlo 5th percentile (the unlucky path), median, 95th percentile, Max drawdown, 95th percentile (with how many times the backtest’s drawdown it is); then CVaR (5%), VaR 95 and Tail ratio. |
| Seasonality | When the money was made, for the basket open in How to combine (or #1, or the joined out-of-sample result): Yearly, Monthly, Weekly, Weekday, DTE and IV regime tabs, the same table as a backtest’s. It follows the basket you pick and the Charges box. |
| Leaderboard | Every setting, ranked by Composite Score (one 0-to-1 blend of Sharpe, Sortino, smoothness, recovery and more). It leads with the six headline figures and Days; + Expand all metrics adds drawdown as a % of capital, time underwater, worst streak, entries and the rest. Expand a row for its numbers, its own Seasonality, its go-live verdict, and Save this rank, Deploy this rank (saves, then deploys in Paper mode) and Check real costs. |
| Which setting? | (Grid and Bayesian) The parameter map: with two tuned parameters, every kept setting on one grid, shaded by P&L. #1 is outlined; the best robust setting is outlined in amber; a dot marks a robust neighbourhood; a ◆ marks each setting of the basket open in How to combine; a faded cell was scored but fell below the kept rows (so losing settings still show in red), and a dashed cell was not run. The last row and column, Avg, give the average P&L per cell of that entry time or stop (hover for the sum, how many cells and how many were profitable). It is an average and not a total because the cells are variants of one strategy that nobody runs together. With one tuned parameter it is a bar per value. |
| Correlation matrix | The top settings pair by pair. A ringed cell is a pair under 0.3, worth combining. |
| Bayesian convergence | (Bayesian Search only) The best score so far, trial by trial, with dashed lines between rounds. A line that rises and then flattens has converged. |
The order is the one a trader decides in: what to run, whether its edge is real, when it makes and loses money, then the evidence behind the pick.
Saving and deploying a setting. Open a rank in the leaderboard and click Save this rank (save it as a strategy in your My Strategies) or Deploy this rank, which opens a small window: a Strategy name, the size in lots, and optional Combined daily limits (Max loss and Max profit in ₹). Confirm, and the setting is saved and deployed in Paper mode. Tick several rows and click Save selected to save them in one go. These controls appear once the run is saved, which normally happens by itself.
Example: row 3 has a slightly lower score than row 1 but sits in a plateau. Open it, click Deploy this rank, name it NIFTY 30 trail, keep 1 lot, set Max loss 6,000, and confirm. It now runs on paper from the Live Deployments.
Editable costs in the report work like those in a backtest report. Type brokerage and slippage per fill. The Net P&L column, the headline figure, the map and the top rows are all after the government charges the run priced for each setting (shown as Govt charges · Priced per rank in the card), and after your brokerage, charges and slippage. Your Charges rate is added on top of the priced govt charges: use it for anything else your broker bills. Every basket’s P&L, drawdown and ratios are then worked out again, day by day. Each card shows Gross, Govt charges, After charges, then your Brokerage + slippage and Net after all costs.
Margin & ROI sits inside every expanded rank of a saved report (grid and Bayesian). The sweep keeps only daily P&L, so the button replays that setting as a full backtest over the window it was tuned on (free, no credits) and measures the margin NSE would have blocked: SPAN plus exposure on every trade’s legs, at the peak of what was open at once. It then shows Peak margin, ROI for the period and annualised, Max DD of margin, After charges, Capital to hold (peak margin plus the worst fall), the share of Profitable months, the Worst month, and ROI by month and by year, all on that one peak margin. Brokerage and slippage are not included. Nothing is shown until the replay has run; a replay that carried no margin reads Not measured.
Example: the validated setting made ₹1,10,000. Is the edge real? shows Monte Carlo 5th percentile ₹22,000, median ₹1,05,000, Max drawdown, 95th percentile ₹58,000 and Orderings that end in profit 96%. Even an unlucky order of the same days made money, but size the position so a ₹58,000 fall is bearable.
Persona portfolios
Section titled “Persona portfolios”At the bottom of the report, Persona portfolios opens on a click. The Kelly Diversification Engine builds a basket for five kinds of trader from the same results, and splits your Deployable capital between its settings:
| Persona | Picks settings by | Must have | Settings | Most in one |
|---|---|---|---|---|
| Conservative | Highest win rate | Win rate 55% or more | 10 | 15% |
| Aggressive | Highest net P&L | Sharpe 0.5 or more | 7 | 25% |
| Risk-Adjusted | Highest Sortino and Sharpe | Sortino 1 or more | 8 | 20% |
| Balanced | Highest recovery factor | — | 9 | 18% |
| Hedge-Oriented | Pairs whose losses offset each other | — | 12 | 12% |
The Strategy Basket Allocation table gives each setting’s Weight, Capital and Lots, its Net PnL, Win Rate and Max Drawdown, and its Half-Kelly. Half-Kelly is a sizing guide from the win rate and risk:reward, halved for safety and never above 30%. Above it: Combined Net PnL, Max Drawdown and MDR (diversification ratio: above 1 means the settings really do offset each other).
Example: on the Conservative tab, only settings with a win rate of at least 55% qualify. The ten best are chosen. No single one gets more than 15% of the capital, even if its Kelly figure is higher.