Find your way around
Every page of the app has the same frame around it: a menu on the left, a market bar at the top, and a status line at the bottom. This page explains each part.
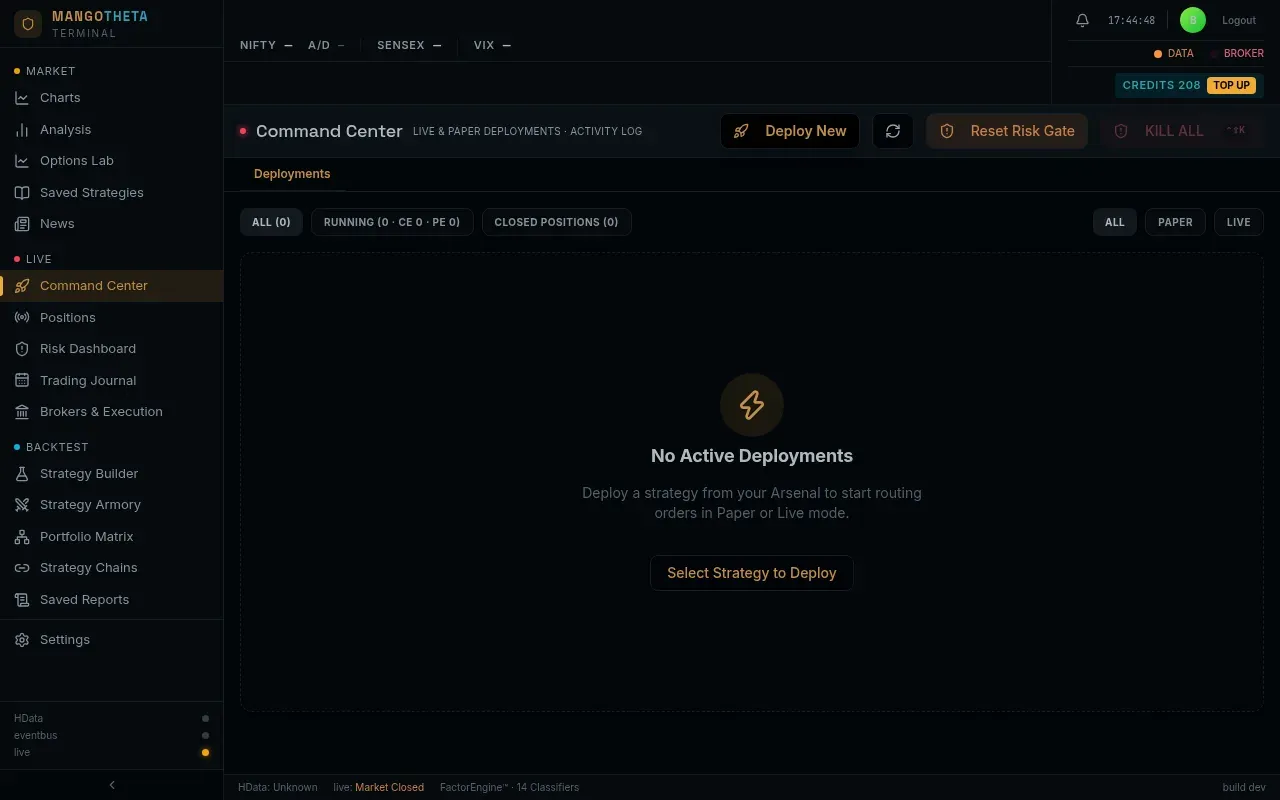
The left menu
Section titled “The left menu”The menu groups the pages into sections. This guide follows the same order.
| Section | What you do there |
|---|---|
| MARKET | Look at the market: charts, option analysis, the Options Lab, news. |
| LIVE | Run strategies on paper or with real money, and watch positions, orders and risk. |
| BACKTEST | Build strategies, test them on past data, tune them, and keep the results. |
| Settings | Your own preferences. |
- Click a page name to open it. The open page is highlighted.
- The ‹ button at the bottom folds the menu into a narrow strip of icons. Click it again to open it.
- On a phone, the menu is hidden. Tap the ☰ button at the top left to open it.
Some pages have tabs under the page title, for example Positions has Strategy Positions and Orders. Each tab is explained on that page’s guide.
The top bar
Section titled “The top bar”The left part of the top bar shows the market. It updates while the market is open. On a phone this part is hidden.
| Item | What it shows |
|---|---|
| NIFTY, SENSEX | The index level, and its change today in points and percent (green up, red down). |
| NIFTY STR, SENSEX STR | The price of the at-the-money straddle (call + put at the same strike). Shown when available. |
| A/D | How many of the 50 NIFTY stocks are trading above their own VWAP (the day’s average price) and how many below. Example: 32/18. |
| VIX | India VIX and its change today. |
| BANK, IT, AUTO, PHARMA, METAL, FMCG | Sector indices, with how many of their stocks are up and how many down on the day (against yesterday’s close). |
A dash (—) means no live value has arrived, for example outside market hours.
The right part of the top bar holds your controls:
| Item | What it does |
|---|---|
| Bell | Opens Smart Alerts. A number on the bell shows how many alerts are waiting. See Alerts. |
| Clock | The current time on your computer. |
| Round letter | Your account. Click it to open My Profile (if it is enabled for your account). |
| Logout | Signs you out of this browser. |
| DATA light | The market data feed. Green: data is flowing. Yellow: the market is closed. Red: the feed is off or the server cannot be reached. Hover over it for the exact state. |
| BROKER light | The live analytics service behind your main broker’s data. Green when the server confirms it is running, red otherwise. It does not test your broker login: use Check Live Brokers on the Brokers & Execution page for that. |
| CREDITS | Your credit balance. Running a backtest or a tuning job uses credits. |
| TOP UP | Opens the page where you add credits. |
The lights check the server every 10 seconds while the page is open.
Plans and credits
Section titled “Plans and credits”Every account starts with a 5-day free trial: 100 credits, Grid Search, Bayesian Search and Walk-Forward, runs of up to 50 combinations over up to 1 year of data. After it, runs need a plan: Plus or Professional. A bar under the top bar shows the days left in the trial, and says when it has ended. Without a plan you can still open My Strategies, Saved Reports, your deployments and My Profile; nothing is deleted.
A plan sets what one run may do: which AutoTune modes you can use, how many combinations a run may try, how many years of data it may cover, how many AutoTune runs you can have going at once, and how many paper-trading strategies you can deploy. A run beyond your plan is refused before any credit is taken, and the message names the plan that allows it.
The trial’s credits are spent first and end with the trial. A paid plan brings plan credits at the start of each plan month. They are spent first, and any left unused reset at the next plan month. Credits you top up, and credits from invites, never expire. CREDITS in the top bar is the two together.
Adding credits or buying a plan
Section titled “Adding credits or buying a plan”Click TOP UP in the top bar to open Add Funds via UPI. Choose Plan to buy a plan, or Top-up to add credits.
- On Plan, pick Monthly or Yearly and the plan. The amount is set to the plan’s price. On Top-up, type the amount.
- Scan the QR code with any UPI app and pay that amount.
- Note the 12-digit UTR / UPI reference number from your payment app.
- Fill in Sender Name (As per Bank) and the 12-Digit UTR / Reference Number, and the amount for a top-up.
- Click Submit Payment for Verification.
The reference must be exactly 12 digits; anything else shows Must be exactly 12 digits. After you submit, the page says Request Submitted Successfully!
Every ₹1 you top up adds one credit, and the smallest top-up is ₹100. A plan starts, and credits are added, after an administrator checks the payment, so they do not appear instantly. Your balance in the top bar updates once they are added. If your top-up balance covers a plan’s price, Plan also offers to pay for it from your balance.
Example: you pay ₹500 from your UPI app. It shows the reference 412345678901. On Top-up, type your
name as your bank shows it, 500, and that number, then submit. When the payment is checked,
CREDITS in the top bar goes up.
Buying the plan you are on again renews it: the new period starts when the one you paid for ends. Buying a different plan starts it straight away. You keep the plan credits of the month in progress, and the months of the old plan you had not started go to your balance.
Your plan, cancelling and invites
Section titled “Your plan, cancelling and invites”My Profile → Subscription & Credits shows your plan, your plan credits and balance, when the next plan credits arrive, and your credit history.
- Cancel plan appears when your plan has months not yet started (a yearly plan, or a renewal you paid for ahead). The month in progress runs to its end; the months not started go to your balance at the rate you paid. Nothing is refunded in cash. A monthly plan ends on its own at the end of its month.
- Invite a trader gives your invite link. You and the trader who signs up with it each get credits once their account is verified, and more each when they make their first payment.
The status line at the bottom
Section titled “The status line at the bottom”| Item | What it shows |
|---|---|
| HData | Connected when the market-data service is reporting in, otherwise Unknown. |
| live | The live feed state: Active, Market Closed, Connecting, Offline or Unreachable. |
| FactorEngine™ · 14 Classifiers | A fixed product label. |
| build | The version of the app you are using. Useful when you report a problem. |
Smart Alerts
Section titled “Smart Alerts”Click the bell in the top bar to open Smart Alerts.
- Scan runs all the alert checks now. Alerts are not checked by themselves in the background: they appear after someone presses Scan.
- The tabs ALL, CRITICAL, WARNING and INFO filter the list by how serious each alert is.
- Click the tick on an alert to mark it as seen; it leaves the list. Ack All clears the whole list.
- The list shows alerts from the last 12 hours that nobody has marked as seen.
The checks:
- India VIX above 20 (a spike) or below 13 (options are cheap);
- dealers short gamma (net GEX below zero) on an index;
- a put-call ratio above 1.3 or below 0.5;
- RSI above 70 or below 30 on the main indices;
- unusual volume (more than 3 standard deviations from normal);
- the index more than 1% away from max pain;
- your portfolio’s 99% VaR above 5%, or its drawdown above 10%.
Example: at 10:15 you press Scan. Two WARNING alerts appear: India VIX is 21 (above 20; above 25 it would be CRITICAL), and RSI on NIFTY is 72. You read them, decide nothing needs doing, and click Ack All: the list is empty again.