Walk Forward and Walk Forward 2
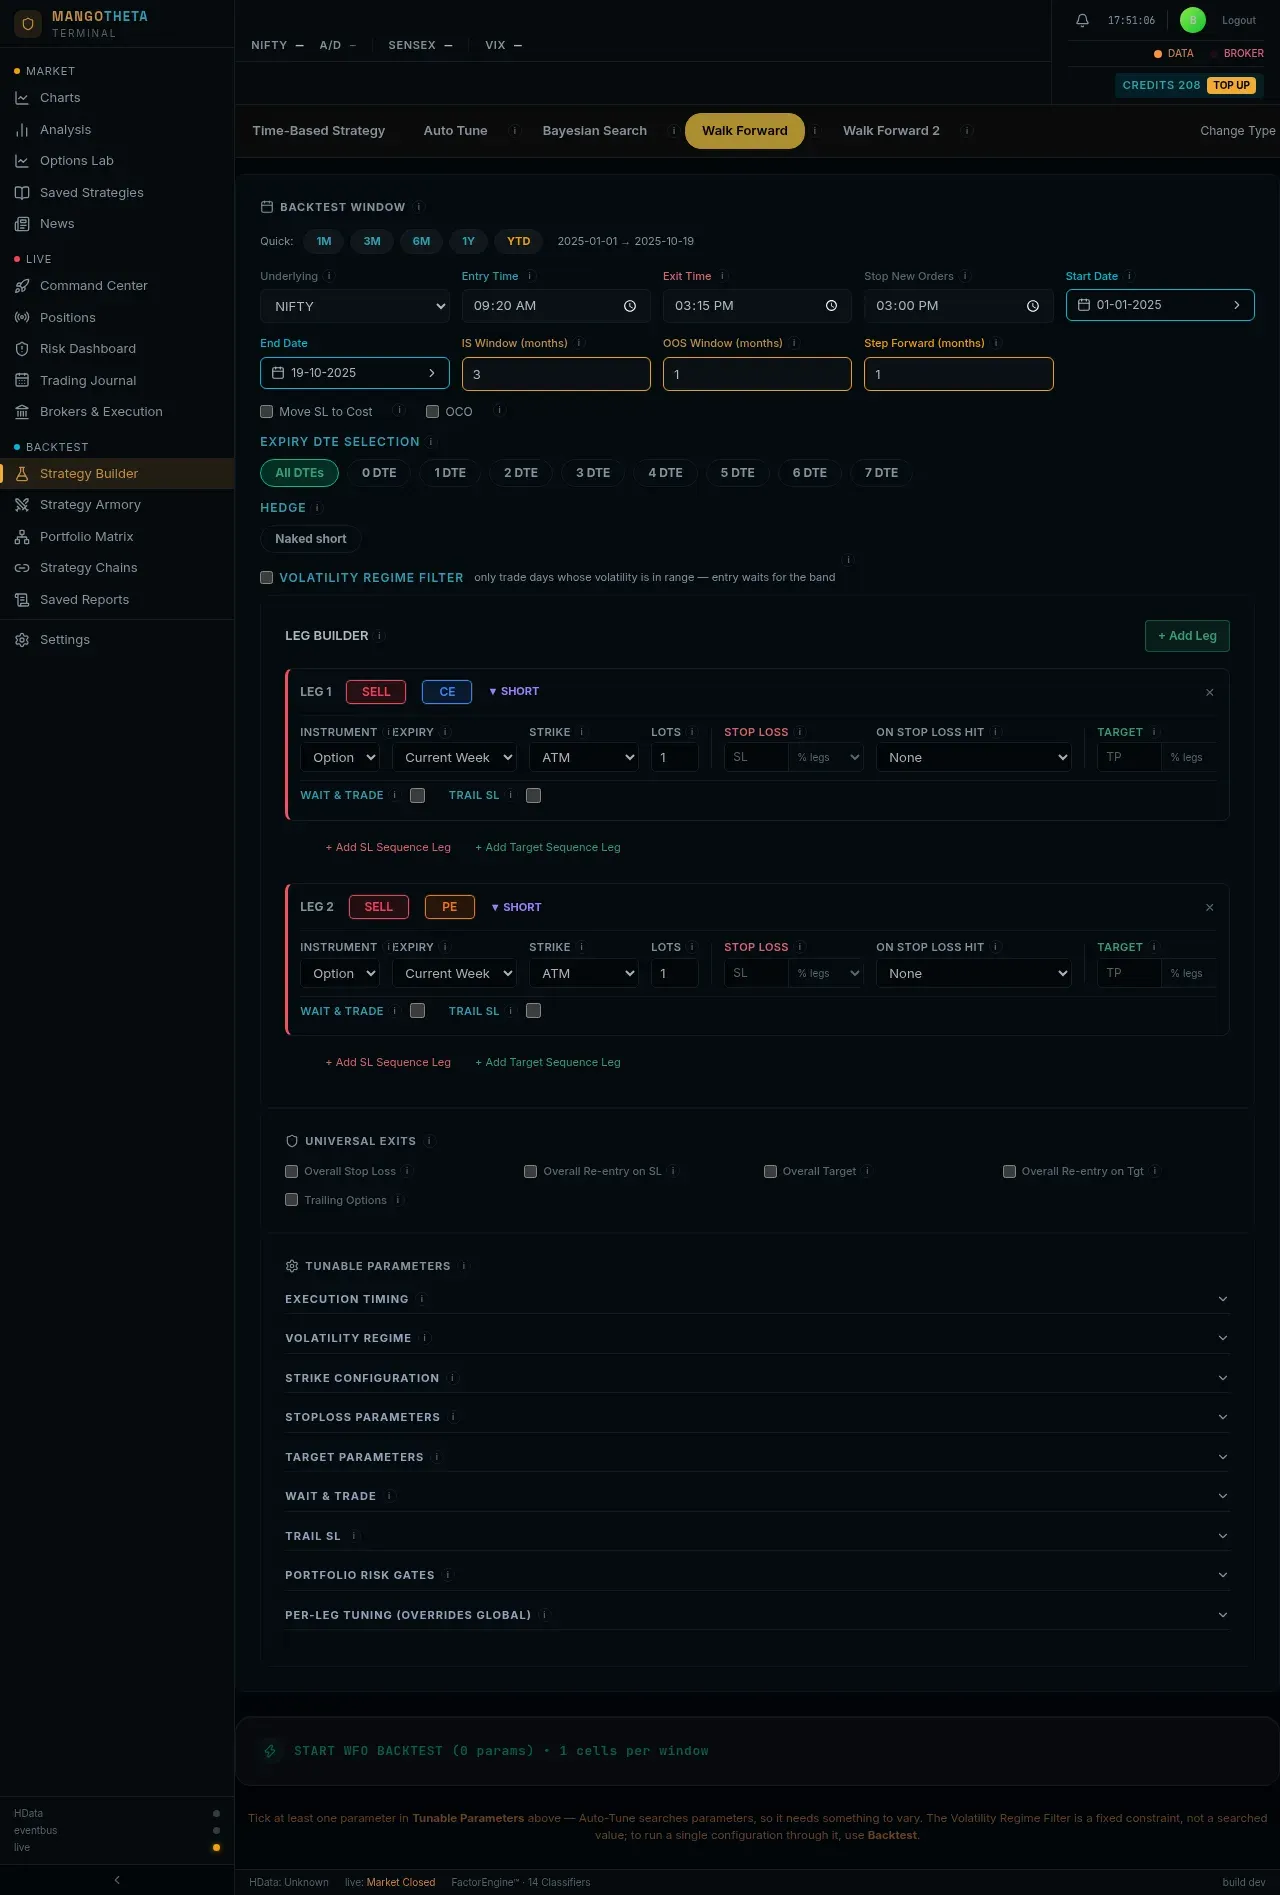
Walk Forward checks whether tuning a strategy actually helps. It tunes on a few months, then trades the next month with those settings without changing them, and repeats this through your whole date range. It is the test a lucky setting fails.
Where to find it: Strategy Builder → build a strategy → the Walk Forward or Walk Forward 2 tab.
Why it matters
Section titled “Why it matters”Any search over many settings finds one that looked great on the data it searched. That does not mean it will work on new data. Walk Forward only ever judges a setting on days it was not tuned on, the way you would trade it for real.
How the windows work
Section titled “How the windows work”| Setting | What it does | Starts at |
|---|---|---|
| IS Window (months) | How many months each round tunes on (in-sample). | 3 |
| OOS Window (months) | How many following months each round then trades unseen (out-of-sample). | 1 |
| Step Forward (months) | How far the whole pair moves forward before the next round. | 1 |
Example: data from January to December, IS 3, OOS 1, Step 1.
| Round | Tune on (IS) | Trade unseen (OOS) |
|---|---|---|
| 1 | Jan – Mar | Apr |
| 2 | Feb – Apr | May |
| 3 | Mar – May | Jun |
| … | … | … |
| 9 | Sep – Nov | Dec |
Each OOS month is traded with the settings that won the 3 months before it. Joined together, the OOS months show what a “tune every month” routine would have done.
Everything else on the tab (the Backtest Window, filters and Tunable Parameters) works as on Auto Tune. The launch button shows the size of the run, for example START WFO BACKTEST (2 params) • 8 cells × 9 windows = … fold backtests.
Walk Forward: reading the results
Section titled “Walk Forward: reading the results”The summary at the top:
| Item | What it shows |
|---|---|
| OOS PnL (True Profit) | All the unseen months added together: the honest result of the routine. |
| Avg OOS Score | The average out-of-sample score across rounds. |
| IS→OOS Degradation | On average, how much the score dropped from the tuned months to the unseen month. |
| Overfit Windows | How many rounds failed (dropped more than 40%). |
| Param Consistency | The share of rounds that picked exactly the most common winning setting. 4 of 9 rounds picked the same setting: 44%. Settings that change every round are a warning sign. |
| Institutional Verdict | ROBUST: every round ran, the average drop is under 30%, and at most a quarter of rounds failed. One failed round is always allowed: with 3 rounds, 1 may fail. NO_IS_EDGE: the strategy did not make money even on the months it was tuned on. OVERFIT_RISK: anything else. |
The table, one row per round:
| Column | What it shows |
|---|---|
| Window, IS Period, OOS Period | The round and its two date ranges. |
| Best Params | The setting that won the in-sample months. |
| IS Score / IS PnL | How that setting did on the months it was tuned on. |
| OOS Score / OOS PnL | How the same setting did on the next, unseen month. |
| OOS Trades / OOS Win% | How much it traded unseen. A win rate from fewer than 30 trades is marked *: too few to trust. |
| OOS MaxDD | The worst fall in the unseen month. |
| Degradation | (1 − OOS score ÷ IS score) × 100. Green under 30%. |
| Status | PASS, FAILED (the score dropped more than 40%), NO EDGE (nothing scored above zero in-sample, so there was nothing to test) or NO RESULT (the round could not run). |
Under each round you can open the runners-up and their own out-of-sample results.
Example: a round’s setting scored 2.0 in-sample and 1.5 out-of-sample: degradation 25%, PASS. If it had scored 1.0 out-of-sample, degradation would be 50%: FAILED.
Does the in-sample ranking mean anything?
Section titled “Does the in-sample ranking mean anything?”A coloured box above the table asks a deeper question: within each round, did the settings that ranked high in-sample also rank high out-of-sample? It shows the IS→OOS rank correlation (from −1 to 1) and how many settings it is based on. It adds a p value (how likely that correlation is by chance), how many settings survived, and a verdict:
| Verdict | When |
|---|---|
| SELECTABLE | The correlation is 0.3 or more, unlikely to be chance, and some settings survived. Tuning picks real winners. |
| BARELY SELECTABLE | The correlation is above 0 but under 0.3. |
| TOO FEW WINDOWS TO TELL | The correlation is above 0, but with this few rounds it could be chance (p above 0.05). |
| RANKED CORRECTLY — ALL FAILED | The ranking held, but every setting lost out of sample: it only ranked the losers correctly. |
| NOT SELECTABLE | The correlation is 0 or below: the in-sample rank told you nothing. |
Next to it:
- Selection Depth: did rank 1 beat a randomly chosen rank?
- Walk-Forward Efficiency: the out-of-sample profit per day, as a percent of the in-sample profit per day.
- Selected winners by: which measures picked the winners.
Example: IS→OOS rank correlation +0.41, p 0.01, 23/40 survived: SELECTABLE. Walk-Forward Efficiency 55% means the unseen months earned a bit over half of what the tuned months did per day, which is a normal drop. A correlation of +0.05 would read BARELY SELECTABLE: the “best” setting each round was close to a random pick.
Rows marked SURVIVED held up out of sample. The ALL WINDOWS (sum) row adds every round together; it is a total, not a setting you can save.
Walk Forward 2
Section titled “Walk Forward 2”Walk Forward 2 uses the same windows. But instead of carrying one winner into each test month, it carries a basket of the top settings (Top 5 or Top 10), chosen by several different measures. It answers: “would a basket of good settings have held up?” It gives no PASS/FAILED verdict; you read the numbers.
| Part of the report | What it shows |
|---|---|
| Deploy next | The basket the method would trade next, from the latest in-sample months. Save portfolio saves the basket as one portfolio (not started); Deploy portfolio also adds it to the Live Deployments in Paper mode. |
| Out of sample, joined | The baskets’ unseen months stitched together: the honest result. |
| Hindsight best, joined — not tradeable | The best you could have done if you had known the future. Only a comparison line. |
| Per-window table | Window, In-sample, IS P&L, Out-of-sample, OOS P&L, OOS days and Members measured, for each round. |
| Top 5 / Top 10 | Switch the basket size; both are already worked out. |
| Selection measures | Tabs to read the same windows with baskets picked by a different measure. |
Under each basket, the settings in it are listed with their in-sample and out-of-sample P&L and rank, and Score degradation. Save and Deploy next to a setting do the same for that one setting alone.
More parts of a Walk Forward 2 report:
| Part | What it shows |
|---|---|
| In sample, joined | The same join over the months the baskets were chosen on. Shown only when those months do not overlap. It is optimistic by design, because the settings were fitted to those months: the drop from it to the out-of-sample card is what walk-forward measures. |
| Captured % | The baskets’ out-of-sample P&L as a share of Hindsight best. Low with a high hindsight figure: the chance was there and the selection missed it. Low with a low hindsight figure: there was nothing to find. |
| In-sample to out-of-sample rank agreement | Per window, whether settings that ranked high in-sample also ranked high afterwards. Near zero means the in-sample ranking told you nothing. |
| Members measured | How many of the basket’s settings actually traded in that unseen month, for example 6 / 10. |
| Score degradation | How much of its composite score a setting kept out of sample. It is not the P&L drop: a setting can earn less but score better if its drawdown shrank. |
| What this window swept | How many combinations each round tested and how many actually traded. |
| Top Losers (control) | The worst in-sample settings, measured the same way. If they did as well out of sample as the winners, the ranking carried no information. It cannot be saved or deployed. |
| Seasonality | When the joined out-of-sample result made its money: by year, month, week, weekday, days to expiry and IV regime, the same table as a backtest’s. |
Example: Out of sample, joined ₹48,000 and Hindsight best, joined ₹1,60,000: Captured % is 30%. The opportunity was there; a different selection measure (try the other tabs) might catch more of it. If Top Losers (control) also made about ₹45,000, the selection is not helping at all.
Good to know
Section titled “Good to know”- Out-of-sample months with very few trades prove little. Look at OOS trades and OOS days.
- If most rounds say FAILED, the tuned setting does not carry forward. Use simpler settings, or drop the idea.
- A Walk Forward run is much bigger than a backtest: rounds × combinations. Start with few parameters and short ranges.