Trading Journal
The Trading Journal scores the trades your deployments actually made, with the same measures a backtest report uses. It has two tabs: Journal and Execution Telemetry.
Where to find it: left menu → LIVE → Trading Journal.
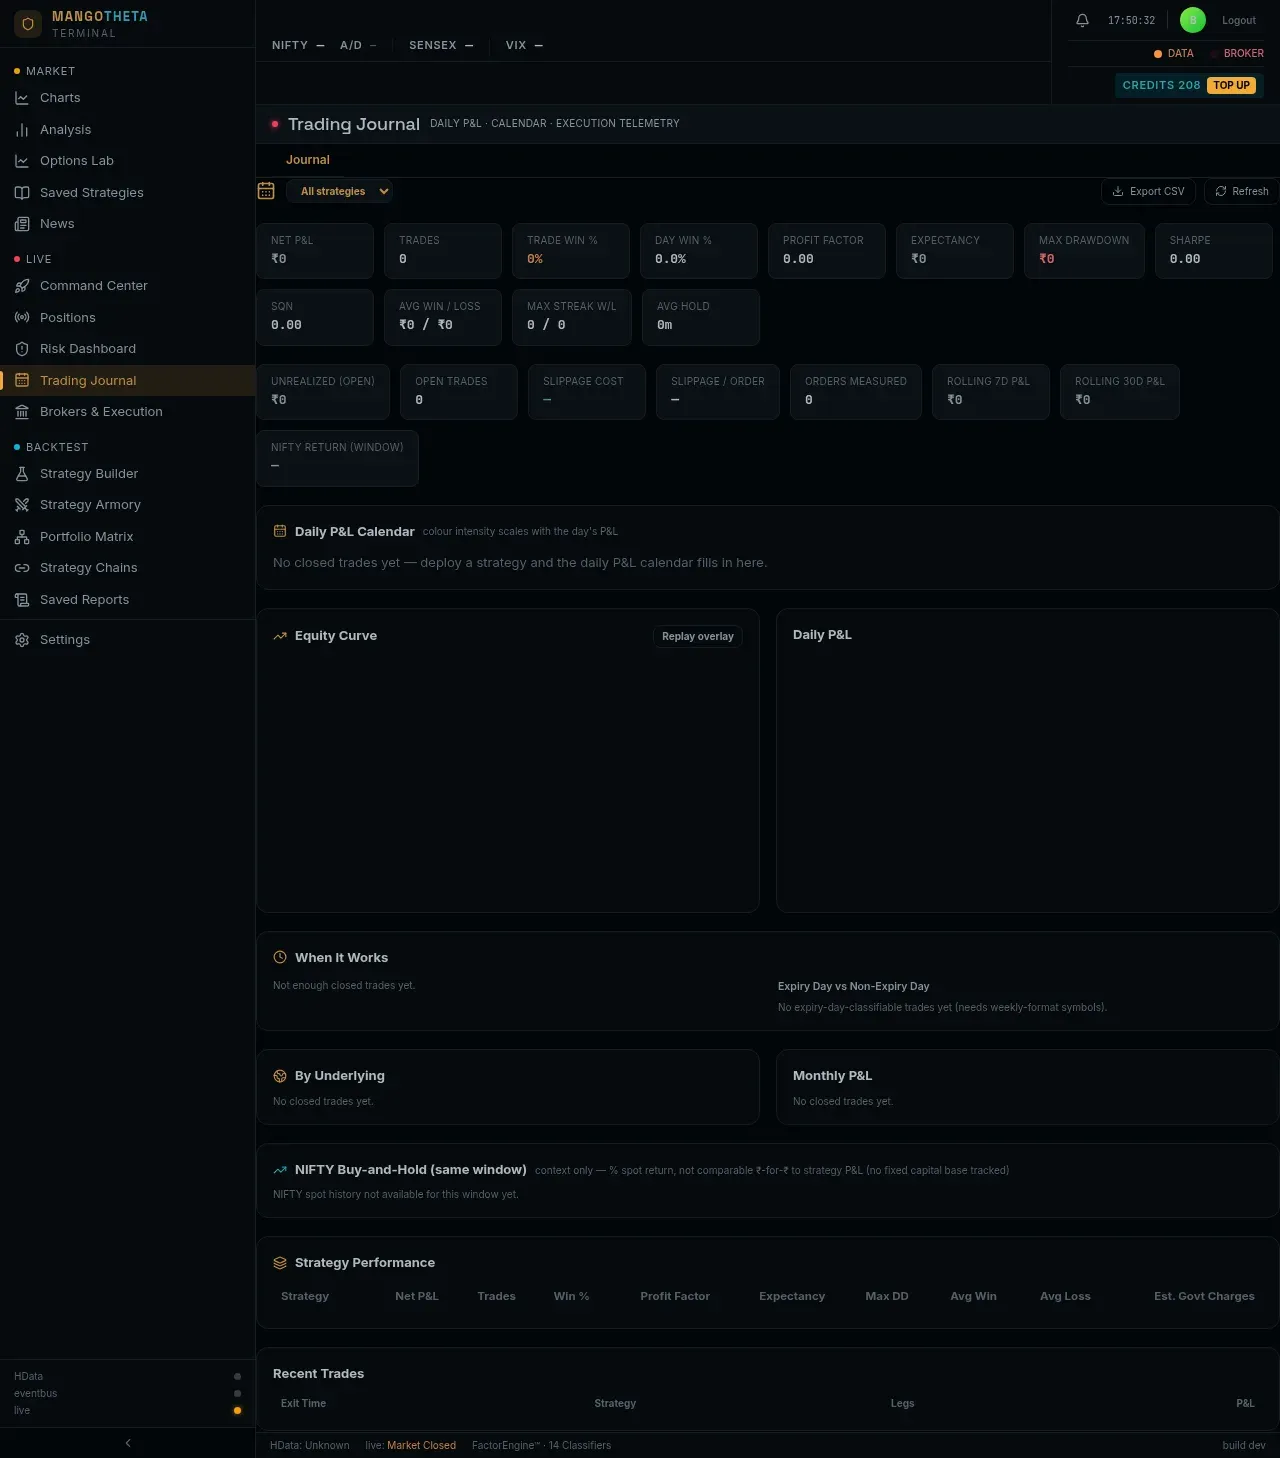
Journal
Section titled “Journal”The journal includes your paper and live trades. A trade’s P&L counts on the day it closed.
At the top:
- The strategy dropdown: All strategies, or one strategy.
- Export CSV: download the trades as a spreadsheet file.
- Refresh: reload.
The summary tiles
Section titled “The summary tiles”| Tile | What it shows |
|---|---|
| Net P&L | Total P&L of closed trades. |
| Trades | How many trades closed. |
| Trade Win % | Share of trades that made money. |
| Day Win % | Share of days that ended in profit. |
| Profit Factor | Money made on winning days ÷ money lost on losing days. |
| Expectancy | Average P&L of a day that traded. |
| Max Drawdown | The biggest fall from a high point of total P&L. |
| Sharpe | Average daily P&L ÷ how much it varies from day to day, scaled to a year. Higher means steadier. |
| SQN | A score for how steady the results are. Under 2, the result could easily be luck. |
| Avg Win / Loss | Average winning trade and average losing trade. |
| Max Streak W/L | Longest run of winning and of losing days. |
| Avg Hold | How long a trade stayed open, on average. |
Example: Trade Win % 45% but Day Win % 60%: you lose more single trades than you win, but most days still end green because the winning trades are bigger. Max Streak W/L 6 / 3 means your worst run was three losing days in a row.
The second row is about today and your orders:
| Tile | What it shows |
|---|---|
| Unrealized (open) / Open Trades | P&L and count of trades still open. |
| Slippage Cost / Slippage / Order / Orders Measured | What fills cost compared with the price when the order was sent, in total and per order. |
| Rolling 7d P&L / Rolling 30d P&L | P&L of the most recent 7 and 30 days that had closed trades (days with no closed trade are skipped, so the window can reach back further). |
| NIFTY Return (window) | How NIFTY moved over the same period, for comparison. |
Charts and tables
Section titled “Charts and tables”| Section | What it shows |
|---|---|
| Daily P&L Calendar | One square per trading day, green for profit, red for loss; the stronger the colour, the bigger the day. Hover a day for its P&L and trade count. Click a day to list that day’s trades below. Click it again, or × Show All, to go back to recent trades. A small dot compares a replay of your rules on that day with what really traded: green under 15% divergence, amber from 15%, red from 35%, grey when the replay could not be checked. |
| Equity Curve | Your total P&L over time. Replay overlay adds, for each day, what a replay of the same rules on that day’s market data made, so you can compare live with the model. |
| Daily P&L | Each day’s P&L as a bar. |
| When It Works | Results grouped by day of the week and by the hour trades entered, and Expiry Day vs Non-Expiry Day. |
| By Underlying | Results per index. |
| Monthly P&L | Results by month. |
| NIFTY Buy-and-Hold (same window) | How much NIFTY itself moved, in %, over the same dates. It is context only: your P&L is in rupees with no fixed capital, so the two cannot be compared rupee for rupee. |
| Strategy Performance | For each strategy: Net P&L, Trades, Win %, Profit Factor, Expectancy, Max DD, Avg Win, Avg Loss, Est. Govt Charges. |
| Recent Trades | Recent closed trades (or the day you clicked): Exit Time, Strategy, Legs (side, contract, quantity and entry → exit price), P&L. |
| Replay Divergence | Shown under a clicked day that has a replay comparison. For each contract it gives how far the live entry price, exit price and quantity were from the replay (Entry Δ, Exit Δ, Qty Δ). |
Example: Tuesday’s square is dark red with an amber dot. Click it: Recent Trades lists Tuesday’s three trades, and Replay Divergence — 2026-09-29 (22%) shows the live exit of the 24,100 CE was ₹6 away from the replay’s (Exit Δ). Check that exit’s fill in Positions → Orders.
Execution Telemetry
Section titled “Execution Telemetry”How fast and how cleanly your live orders filled. The totals and the broker figures cover the last 24 hours; Recent Fills lists your latest fills, whatever their age. Paper trades are not measured here.
| Item | What it shows |
|---|---|
| Total Fills (24h) | How many live fills. |
| Overall Median Latency | The typical time from the signal to the fill. Half the fills were faster. |
| Overall p95 Latency | 95 out of 100 fills were faster than this. It shows your slow cases. |
| Overall Avg Slippage | Fill price compared with the live price when the order was placed, as a %. Positive means it cost you money. |
| Broker Latency Profile | Median and p95 latency for each broker, as bars. |
| Broker Breakdown | Per broker: Fills, Median Latency, slippage. |
| Recent Fills | Each fill: Signal Time, Broker, Instrument, the price it is measured against, Fill, Slippage, Latency. |
Example: the option was ₹100.00 when the order was placed and it filled at ₹100.50. Slippage is +0.5%, which cost you ₹0.50 per unit.