Risk Dashboard
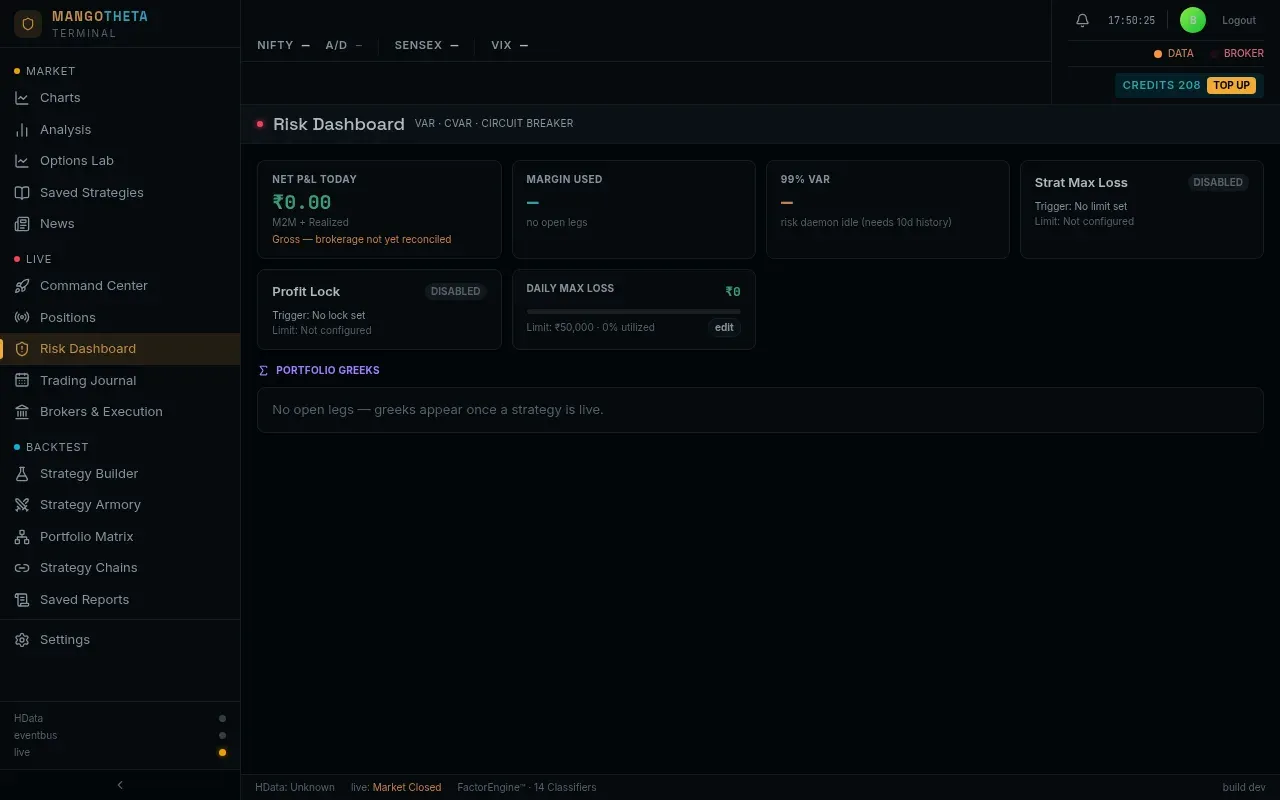
The Risk Dashboard shows how much risk your open positions carry and lets you set the loss limits that protect your account.
Where to find it: left menu → LIVE → Risk Dashboard.
How the limits protect you
Section titled “How the limits protect you”A risk guard checks your positions about every 15 seconds:
| Limit | What happens when it is reached |
|---|---|
| A strategy’s Max Loss (live) | That strategy’s positions are squared off. |
| A strategy’s Profit Lock (live) | That strategy’s positions are squared off, keeping the profit. |
| Your Daily Max Loss | The account kill switch fires: working orders are cancelled, all positions are squared off, and no new entries are allowed for the rest of the day. |
Example: strategy A has Max Loss (live) ₹6,000 and your Daily Max Loss is ₹50,000. At 11:20 strategy A is down ₹6,200: on the next check its positions are squared off, and its Breaker shows TRIPPED. Your other strategies keep running. Only if the whole account reached −₹50,000 would everything be closed and new entries blocked.
After the Daily Max Loss kill switch fires, new entries stay blocked until midnight. This is final for the day: Reset Risk Gate in the Live Deployments does not lift it, and says so if you press it.
The top cards
Section titled “The top cards”| Card | What it shows |
|---|---|
| Net P&L Today | Today’s P&L: open positions (M2M) plus closed ones (realized). The note under it says the figure is gross: brokerage is not taken off yet. |
| Margin Used | An estimate of the margin your open legs need. |
| 99% VaR | Value at risk: a loss your book would pass on only about 1 day in 100, from your own recent daily results. It needs about 10 days of history; until then it says so. |
| Strat Max Loss | ARMED when at least one strategy has a max-loss limit, otherwise DISABLED. |
| Profit Lock | ARMED when at least one strategy has a profit lock. |
| Daily Max Loss | Today’s loss against your daily limit, as a bar. Click edit to change the limit. The default is ₹50,000 unless you set your own. |
Example: Daily Max Loss ₹50,000. Your positions are down ₹12,000. The bar shows 24% used.
Portfolio Greeks
Section titled “Portfolio Greeks”Shown once you have open legs. All figures are for the whole book, with the direction of each leg taken into account.
| Greek | What it means |
|---|---|
| Net Delta (Δ) | Rupees your book gains or loses if the index rises 1%. Shown in amber above ₹5,000. |
| Net Gamma (Γ) | How fast delta changes. Negative (short gamma) means losses grow faster as the index moves. |
| Net Theta (Θ) | Rupees the book gains (or loses) per day from time passing. |
| Net Vega (ν) | Rupees gained or lost if implied volatility rises by 1 point. |
Example: Net Delta −₹3,200, Net Theta +₹4,500, Net Vega −₹2,100. If NIFTY rises 1% the book loses about ₹3,200; each quiet day earns about ₹4,500; and a 1-point rise in implied volatility costs about ₹2,100. That is the usual shape of a short strangle that leans bearish.
Exposure
Section titled “Exposure”- Exposure by Underlying: legs, net delta and P&L per index.
- Exposure by Expiry: legs and P&L per expiry, with days to expiry. Expiries 1 day away or less are marked ⚠.
Example: NIFTY 4 legs, net delta −₹3,200; SENSEX 2 legs, +₹900. By expiry, the Tuesday NIFTY expiry shows 1 ⚠ in the days column: those legs expire tomorrow, when moves near the strike swing their price hardest.
Per-Strategy Risk Monitor
Section titled “Per-Strategy Risk Monitor”One row per strategy:
| Column | What it shows |
|---|---|
| P&L | The strategy’s P&L today. |
| Max Loss (live) | Its daily loss limit. Click to edit; 0 clears it. The change applies on the next check, without a restart. |
| Profit Lock (live) | Its daily profit limit. Click to edit; 0 clears it. |
| Trail Profit | Its trailing profit lock, if the strategy has one (Reach / Lock in ₹). |
| Breaker | ARMED (limit set), TRIPPED (limit hit today) or DISABLED. |
| Action | Square off (n): close all open trades of this strategy with real orders, after you confirm. |
Example: you want strategy B to stop for the day once it is ₹8,000 up. Click its Profit Lock (live), type 8000, and confirm. Breaker shows ARMED. When B reaches +₹8,000 its positions are closed and the breaker shows TRIPPED.
Scenario Analysis
Section titled “Scenario Analysis”A table of what your open book would make or lose if the index moved −3% to +3% and implied volatility moved −5, 0 or +5 points. Green is profit, red is loss; stronger colour means a bigger amount.
Example: the cell for −2% and +5 IV points reads −₹18,500: if NIFTY fell 2% and implied volatility rose 5 points, the book would lose about ₹18,500. If that is more than you can accept, reduce or hedge before it happens.
It is an estimate from today’s greeks. It gets less accurate for large moves and close to expiry.