Options Lab
The Options Lab is where you put together an option position by hand, on today’s live option chain, and see straight away what it can make or lose. You can then save it, ask the app to watch it, or deploy it.
Where to find it: left menu → MARKET → Options Lab.
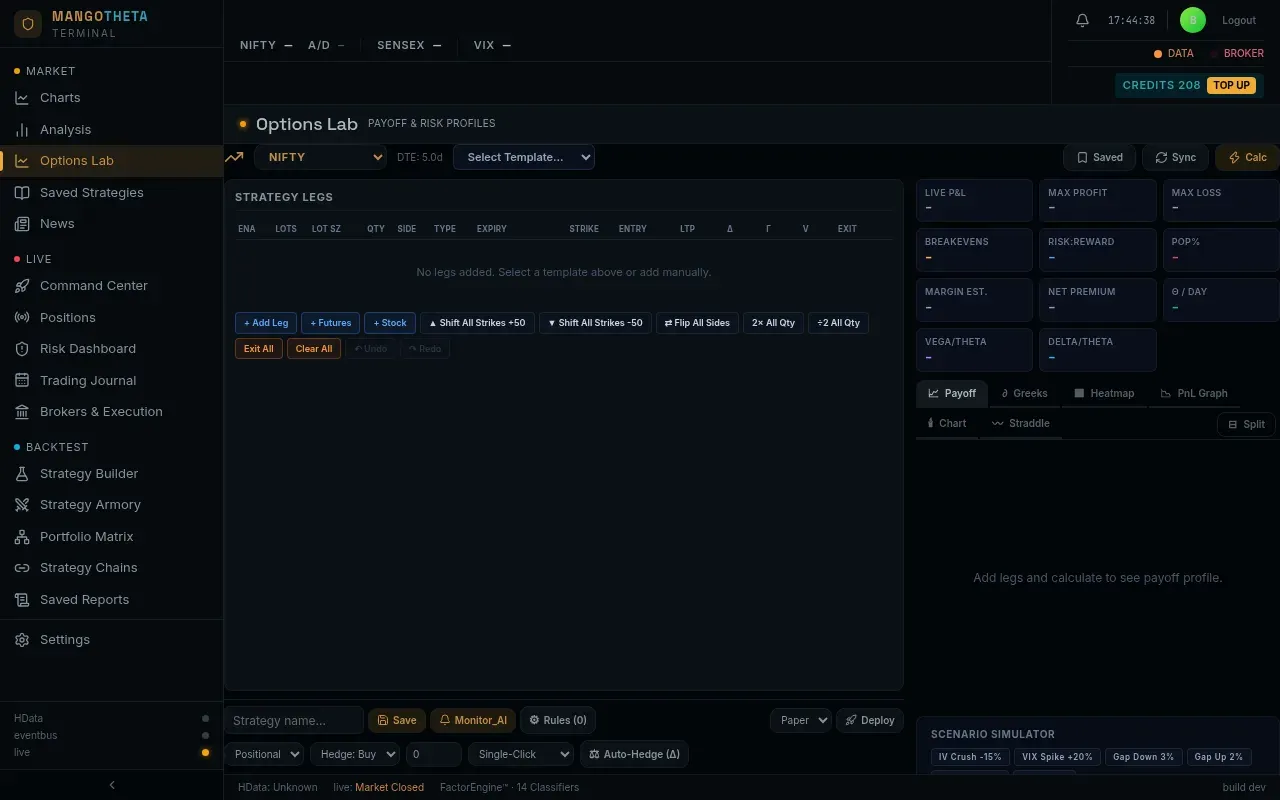
The top bar
Section titled “The top bar”| Control | What it does |
|---|---|
| Symbol (first dropdown) | The underlying: an index such as NIFTY or SENSEX, or an F&O stock. The live price and DTE (days to expiry) show next to it. |
| Select Template… | Fill the legs table with a ready-made structure at today’s strikes: Bull Call Spread, Bear Put Spread, Long Straddle, Short Straddle, Iron Condor, Iron Butterfly, Long Strangle, Short Strangle, Bull Put Spread, Bear Call Spread, Ratio Call, Jade Lizard, Covered Call, Protective Put, Covered Put, Call Calendar, Put Calendar. |
| Saved | Open or close the list of your saved and monitored positions. See Saved and monitored. |
| Sync | Reload the option chain and the prices. |
| Calc | Recalculate the payoff and every number on the right. |
Template legs go on the expiry selected in the chain. The Call Calendar and Put Calendar templates put their far leg on the first listed expiry at least 7 days after it. Every leg is priced from its own expiry’s chain. If a leg has no market price, it is left at 0 and a red message names it: No live price for 24100 CE — enter the entry price before saving. Type the price in ENTRY yourself; the app does not guess one.
Strategy Legs
Section titled “Strategy Legs”Each row is one leg. Build the position here.
| Column | What it is |
|---|---|
| ENA | Tick to include the leg in the calculation. Untick to see the position without it. |
| LOTS / LOT SZ / QTY | Lots, units per lot, and total units. |
| SIDE | BUY or SELL. |
| TYPE | CE, PE, futures or stock. |
| EXPIRY / STRIKE | The contract. |
| ENTRY | The price you entered at: the live price of that strike on the leg’s own expiry when you add the leg. You can edit it. |
| LTP | The live price now. |
| Δ Γ V | Delta, gamma and vega of the leg. |
| EXIT | The exit price, once the leg is exited. |
| P&L | Profit or loss of the leg. |
| ACT | Actions: Rules & Risk (stop loss and target for this leg), Exit at LTP, Partial Exit (exit some of the quantity), Reopen an exited leg, Remove leg. |
Buttons under the table:
| Button | What it does |
|---|---|
| + Add Leg | Opens the option chain. Pick the expiry at the top, then add a call or put from any strike. ← Back returns to the table. |
| + Futures / + Stock | Add a futures or stock leg at the live price. |
| ▲ Shift All Strikes / ▼ Shift All Strikes | Move every leg up or down by one strike step. |
| ⇄ Flip All Sides | Turn every BUY into SELL and every SELL into BUY. |
| 2× All Qty / ÷2 All Qty | Double or halve the size of every leg. |
| Exit All / Clear All | Mark every leg exited, or remove every leg. |
| ↶ Undo / ↷ Redo | Step back or forward through your changes. |
A few details in the table:
- For a stock leg, QTY is the number of shares, not lots.
- Once a leg is exited, its EXIT price can be edited. Example: you exited at the live price of ₹42, but your broker filled you at ₹40. Type 40 in EXIT and the leg’s P&L is worked out from ₹40.
The option chain
Section titled “The option chain”+ Add Leg opens the live option chain for the expiry chosen at the top. Calls are on the left, puts on the right, and strikes in the middle. The at-the-money strike (the one nearest the live price) is marked ATM and kept in view.
| Column | What it shows |
|---|---|
| OI | Open interest: how many contracts are open at that strike. A bar shows it against the biggest OI on screen. |
| OI Chg | How much the open interest changed today. |
| Vol | How many contracts traded today. |
| CE Δ / PE Δ | The delta of the call or the put. |
| CE LTP / PE LTP | The last traded price. Click it to add a leg. |
How clicks work on a price:
- Left-click buys one lot. Right-click sells one lot.
- Click the same price with the same button again to add one more lot to that leg.
- Click it with the other button to take one lot off. When only one lot is left, the leg is removed.
- The same strike on a different expiry is a separate leg, so you can build calendars.
Example: left-click the 24,000 CE price twice: you have BUY 24,000 CE, 2 lots. Right-click the same price once: it drops to 1 lot. Right-click it again: the leg is gone.
If a refresh fails, a red bar Stale — stays above the chain with the reason and a Retry button. The prices you see are then from the last good refresh, not live.
The numbers
Section titled “The numbers”The strip above the chart shows:
| Number | What it means |
|---|---|
| Live P&L | Profit or loss of the open legs at live prices. |
| Max Profit / Max Loss | The most the position can make or lose at expiry. ∞ means there is no limit. |
| Breakevens | The index levels at expiry where the position makes exactly zero. |
| Risk:Reward | Shown as 1 : n: for every ₹1 you can lose, you can make ₹n. Blank when either side has no limit. |
| PoP% | Probability of profit: a model estimate from today’s implied volatility. Not a promise. Green above 60%, amber above 40%, red below. |
| Margin Est. | An estimate of the margin needed. Check with your broker before you trade. |
| Net Premium | Premium received (+) or paid (−) for the whole position. |
| Θ / Day | Time decay per day, in rupees. Positive means time passing earns you money. |
| Vega/Theta, Delta/Theta | The position’s vega (or delta) divided by its daily theta. They show how much volatility (or direction) risk you carry for each rupee of daily decay. A minus sign means theta works against that risk. Blank when theta is under ₹1 a day. |
Example: an iron condor shows Max Profit ₹4,000 and Max Loss ₹8,000. Risk:Reward reads 1 : 0.5: you risk ₹2 to make ₹1. Θ / Day ₹650 means that if nothing else changes, the position gains about ₹650 a day just from time passing.
Charts
Section titled “Charts”| Tab | What it shows |
|---|---|
| Payoff | P&L across index levels, today and at expiry. |
| Greeks | How delta, gamma, theta and vega change with the index. |
| Heatmap | P&L for a grid of index levels and dates. |
| PnL Graph | How the position’s live P&L moved during the session. |
| Chart | The index’s intraday chart with your breakevens drawn on it. |
| Straddle | The at-the-money straddle premium through the day. |
| Split | Keep the payoff on top and show a second chart under it. |
Example: on the Payoff tab of a short straddle at 24,000, the expiry line is a tent: highest at 24,000 and falling on both sides. The today line is flatter, because the options still have time value. Where the expiry line crosses zero are your breakevens.
Scenario Simulator
Section titled “Scenario Simulator”See the position after a change in the market, without waiting for it.
Move the sliders yourself:
- IV Shift (−30 to +30): adds that many points to every leg’s implied volatility. +5 on a leg at 14% IV means 19%, not 14.7%.
- Time Forward: moves the clock that many days ahead (up to expiry).
- Price Shift: moves the index up or down by that percent.
Or click a preset, which sets all three sliders at once:
| Preset | IV Shift | Time Forward | Price Shift |
|---|---|---|---|
| IV Crush -15% | −15 points | 0 | 0 |
| VIX Spike +20% | +20 points | 0 | 0 |
| Gap Down 3% | +5 points | 0 | −3% |
| Gap Up 2% | −3 points | 0 | +2% |
| Sideways T+3 | 0 | 3 days | 0 |
| Expiry Day | −5 points | to expiry | 0 |
The gap presets move IV too, because volatility usually rises when the market falls and eases when it rises.
Example: you sold a strangle with IV at 13%. Click VIX Spike +20%: every leg is repriced at 33% IV and the numbers show the loss you would see straight away. Then click Sideways T+3: three days pass, nothing else changes, and you see how much time decay earns.
A worked example: a short strangle
Section titled “A worked example: a short strangle”- Choose NIFTY. Say NIFTY is at 24,000.
- Pick Short Strangle from Select Template…. For NIFTY it sells the strikes 100 points either side of the money. Suppose it fills: SELL 24,100 CE at ₹85 and SELL 23,900 PE at ₹80, 1 lot each (65 units).
- Click Calc.
- Read the numbers:
- Net Premium: (85 + 80) × 65 = ₹10,725 received.
- Max Profit: ₹10,725, if NIFTY ends between 23,900 and 24,100 at expiry.
- Breakevens: 24,100 + 165 = 24,265, and 23,900 − 165 = 23,735.
- Max Loss: ∞. Beyond a breakeven the loss keeps growing as the index moves.
- Try Gap Up 2% in the Scenario Simulator to see the loss if NIFTY opens 2% higher.
Save, monitor, deploy
Section titled “Save, monitor, deploy”Type a name in Strategy name… first. Then:
| Button | What it does |
|---|---|
| Save | Saves the position to your saved list (and to the Tracked Positions page). If you opened a saved one to edit, the button says Update and changes it instead of making a copy. |
| Monitor_AI | Saves the position as monitored. While the market is open its live P&L updates about every 10 seconds, and its checks and your Rules are tested about every 5 minutes. When one is crossed, an AI-written adjustment note appears on its card under Saved. At most one note every 30 minutes per position. It places no orders. |
| Rules (n) | Open the Risk & Rules Engine: stop losses, targets and other rules for the position. n is how many rules it has. See Rules and risk. |
| Paper / account dropdown | Where Deploy sends the position: Paper, or one of your connected broker accounts (accounts that are not connected are greyed out). |
| Deploy | Starts the position as a real deployment. See below. |
| Positional / Intraday | The style used by Monitor_AI when it judges the position. |
What Deploy does
Section titled “What Deploy does”- The position is first saved to your My Strategies, then started.
- It enters about 5 seconds later, runs intraday, and is squared off at 15:15.
- Only index positions can be deployed. Stock positions are for analysis only.
- You manage it from LIVE → Live Deployments, like any other deployment.
- Only three kinds of rule are carried into a deployment, all with 🔴 Square Off All: Total Net PnL below a negative amount (a stop loss), Total Net PnL above a positive amount (a target), and Trailing SL. Every other rule is reported as alert-only in the deploy message and does not act on the deployment.
Rules and risk
Section titled “Rules and risk”Click Rules (n) under the chart, or the Rules & Risk icon on any leg. The Risk & Rules Engine window has three tabs. Click Save n Rules at the bottom to keep your changes, or Cancel to drop them.
Each setting carries a badge:
- 🟢 Executes on Deploy: when you Deploy the position, the deployment acts on it by itself and closes legs.
- 🟡 Alert on Monitor: it is only checked while the position is under Monitor_AI, and it only writes an alert note. Nothing is closed for you.
MTM below means the position’s live profit or loss in rupees.
Strategy Risk
Section titled “Strategy Risk”Three limits for the whole position. Leave a box empty to switch it off.
| Box | What it does |
|---|---|
| Overall Stop Loss (MTM) | Close every leg when the loss reaches this many rupees. |
| Overall Target (MTM) | Close every leg when the profit reaches this many rupees. |
| Trailing Stop Loss | Close every leg when the profit or loss falls this many rupees below its highest point so far. |
Example: Overall Stop Loss 5,000, Overall Target 10,000, Trailing Stop Loss 2,000. The position climbs to +₹7,000 and then slips. When it reaches +₹5,000 it is ₹2,000 below its best, so every leg is closed with about ₹5,000 profit. Had it gone straight down instead, it would have closed at −₹5,000.
Leg Risk
Section titled “Leg Risk”One card per leg. Click a card to open it.
| Setting | What it does |
|---|---|
| Stop Loss | SL Value and a Unit: % legs (percent of this leg’s entry price), pts legs (option price points), % index or pts index (a move in the index). On SL Hit says what to do next: None (the leg stays closed), Re-Entry or Re-Execute, up to Max Attempts times (empty means once). |
| Target (TP) | The same, for profit. On TP Hit offers None, Re-Entry or Re-Execute, with its own Max Attempts. |
| Trailing SL | Tick Enable. For every full Profit Reach (lock begins) of profit, the stop moves Lock At in your favour, in Pts or % (of the entry price). It starts from the leg’s stop loss, or from the entry price if there is none, and never moves back. The same rule as Trail SL in the Strategy Builder. |
| Partial Exits | Add Exit adds a row: when the leg hits a Target or SL level (At Value, Unit), close part of it, either a percent of the lots still open or a number of Lots. Move SL→Cost then moves the rest’s stop to its entry price. A row with no level or no size is ignored. |
Example: you sold the 24,100 CE at ₹80. A Stop Loss of 50 in % legs closes it if the price rises to ₹120 (80 + 50%). Now add a Partial Exit: Target, 50 % legs, Exit % 50, with Move SL→Cost ticked. When the price falls to ₹40, half the leg is closed. The stop on the other half moves to ₹80, so the rest can no longer lose money.
Advanced Rules
Section titled “Advanced Rules”Your own if this, then that rules. Click Add Custom Rule, or open ⚡ Quick Presets and start from one of these:
| Preset | The rule it adds |
|---|---|
| Strategy SL ₹5K | Total Net PnL below −₹5,000 → 🔴 Square Off All. |
| Trailing SL ₹3K | P&L ₹3,000 below its high → 🔴 Square Off All. |
| Leg Premium < ₹5 | The first leg’s price below ₹5 → alert Leg premium near zero — consider exit. |
| 50% Decay Target | The first leg has lost 50% of its entry price → alert book partial profit. |
| Spot Move > 1.5% | The index has moved 1.5% either way since entry → alert review position. |
Each rule has a Rule Name, an IF CONDITION and a THEN ACTION:
- Metric, grouped as:
- P&L: Total Net PnL (₹), Leg PnL (₹), Trailing SL (drop from high);
- Premium: Leg LTP (₹), Premium Decay (%);
- Spot: Spot Move (%), Spot Move (Points);
- Greeks: Net |Delta|, Net Gamma, Net Theta, Net |Vega|;
- Time / IV: DTE Threshold (days to expiry), IV Change (%).
- Op (
>,<,≥,≤,=,≠) and a value. Tick |Abs| on the spot and IV metrics to count a move either way. - Leg # for the leg metrics. Leg numbers start at 0: 0 is the first leg, 1 the second.
- Action: 🔔 Alert Only (with your Message), 🔴 Square Off All, ✂️ Close Specific Leg (Target Leg #), or 🔄 Roll Leg (Dynamic Strike) (Target Leg # and a Strike Offset in points from the index).
The toggle on each rule switches it on or off; Clone copies it; Delete removes it.
Example: you want a warning, not an exit, if NIFTY runs 200 points either way. Add a rule: Metric Spot Move (Points), >, 200, |Abs| ticked, Action 🔔 Alert Only, Message Check the hedges. It shows 🟡 Alert on Monitor: it will write that note while the position is monitored, and it does nothing on a deployment.
Only two kinds of advanced rule act on a deployment: Total Net PnL with 🔴 Square Off All, and Trailing SL with 🔴 Square Off All (see What Deploy does). Under Monitor_AI every action, even Square Off All or Roll Leg, only writes advice: the app does not close or roll anything for a monitored position.
Hedging tools
Section titled “Hedging tools”These change the legs on your screen. They do not place orders.
| Control | What it does |
|---|---|
| Hedge: Buy / Hedge: Sell | Whether the hedge leg the app adds is bought or sold. |
| Target Δ box | The delta to hedge to. 0 means fully neutral. |
| Single-Click / Auto Re-hedge | Hedge once when you press the button, or re-check every 30 seconds while this page stays open. With Auto Re-hedge, a Band box sets how far delta may drift before it acts. |
| Auto-Hedge (Δ) | Adds (or resizes) one at-the-money option leg so the position’s delta moves to the target. |
Which leg it adds: to bring delta down, Hedge: Buy buys a put and Hedge: Sell sells a call. To bring delta up, Buy buys a call and Sell sells a put. It always uses the at-the-money strike, and sizes the leg in whole lots. If delta is already within 1 of the target, it says so and adds nothing.
Example: your NIFTY position has a delta of +60 (it gains about ₹60 for each point NIFTY rises), and you want it neutral. Leave Target Δ at 0, choose Hedge: Buy, and click Auto-Hedge (Δ). The at-the-money put has a delta of about −0.5, so one lot of 65 covers about 32 delta. The app adds BUY ATM PE, 2 lots, and the position’s delta becomes about −5. Click it again later and it resizes that same leg instead of adding another.
Saved and monitored
Section titled “Saved and monitored”Click Saved in the top bar.
- Active Rule-Based Strategies: saved positions that have rules.
- Saved Templates: saved positions without rules.
- 🚨 Monitored Strategies: positions under Monitor_AI, each as a card with its live P&L and the latest note. Click a card to load it; use its stop button to stop watching it.
Hover a saved row to see its two buttons: Load puts its legs back into the table (clicking the row does the same), and the bin deletes it. On a monitored card, the bin stops monitoring it. When a card has a new note, hover it to read the ⚡ Adjustment Triggered box: the AI’s advice and the action it suggests.
Example: you monitor a short strangle with the preset Spot Move > 1.5%. NIFTY rallies 1.6%: on the next check (within about 5 minutes) the card gets a note. Hovering it shows ⚡ Adjustment Triggered, the AI’s advice about the move, and an ADJUST tag. The legs are not touched.
The notes are written by the server’s AI service. If that service is not set up or returns nothing, no note appears, even when a rule fires.