Portfolio Builder
A portfolio runs several strategies side by side. The Portfolio Builder lets you build portfolios, backtest them as one, and compare them.
Where to find it: left menu → BACKTEST → Portfolio Builder.
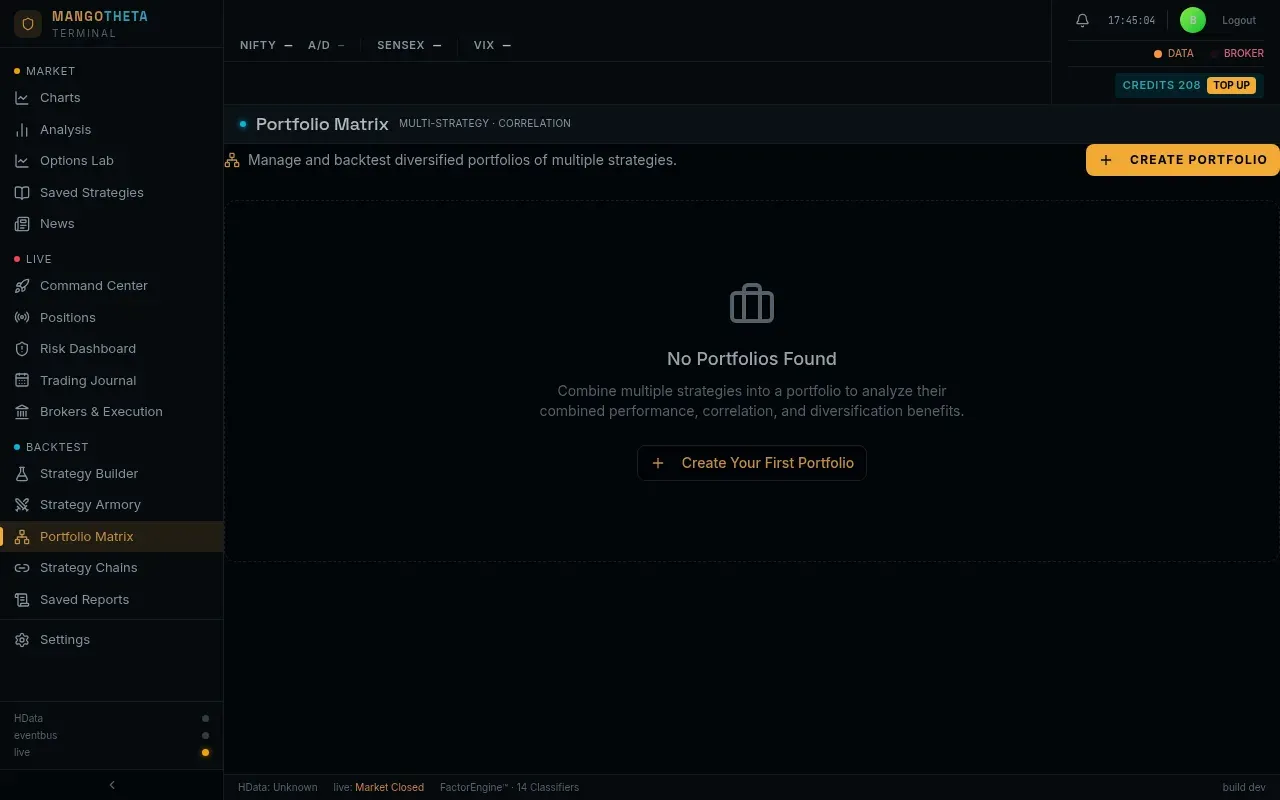
Two kinds of portfolio appear on this page:
| Kind | Where it comes from | Can you deploy it? |
|---|---|---|
| Saved Portfolios | Baskets you saved from an Auto Tune or Walk Forward report. Stored on the server. | Yes |
| Assembled Portfolios | Portfolios you build here with CREATE PORTFOLIO. | No (backtest and compare only) |
Build a portfolio
Section titled “Build a portfolio”- Click CREATE PORTFOLIO.
- Type a Portfolio Name, for example Index iron condors.
- Tick the strategies to include. They are grouped as Time Based Strategies, Indicator Based Strategies, AI Copilot Strategies and Production Grade Strategies.
- Click SAVE PORTFOLIO.
You need at least two strategies to backtest a portfolio.
Assembled Portfolios
Section titled “Assembled Portfolios”| Column | What it shows |
|---|---|
| Portfolio Name | The name and when it was last changed. |
| Strategies Count | How many strategies it holds. |
| Included Strategies | The first few names. |
| Actions | Backtest, edit (pencil), delete (bin). |
Saved Portfolios
Section titled “Saved Portfolios”Each row shows the basket’s name and the measure that picked it (a badge). It also shows how many strategies and legs it has, and its basket stop loss and target if it has them.
- Click a row to open it and see every member: Strategy, Legs / Lots, Entry → Square-off, Stop Loss. Edit changes one member.
- Backtest runs the whole basket.
- Deploy adds it to the Live Deployments (stopped, in Paper mode).
- The bin deletes it.
Backtesting a portfolio
Section titled “Backtesting a portfolio”The members run together on the same days, and the report shows their combined result plus these portfolio sections. A portfolio can mix indices: each member trades only its own index, at that index’s lot size, and Underlying lists every index the members use.
Each member also keeps the days-to-expiry filter it was saved with, the same one its deployment trades by: DTE filters lists them. The DTE chips apply only to members saved without a filter, and they are hidden when every member has one.
Basket SL (₹) and Basket target (₹) start from the saved basket’s own limits; leave a box empty to run without that limit. When the day’s P&L of all members together reaches either one, every member is squared off at that minute and stays out for the rest of the day, as in paper and live trading. The report’s header shows each limit and how many days it was hit.
- Strategy Comparison: one row per member with Net P&L, Max DD, RMDD, Win %, PF, Sharpe, Sortino, Calmar, SQN, Expectancy, Exp.R, R:R, Kelly %, Legs and Loss streak, each after government charges like the six figures. Click a column to rank by it; the best value in each column is in bold. A member that never lost shows ∞ for its ratios.
- Correlation Heatmap: how alike each pair of members’ daily results is, from −1 to +1. Red cells move together and do not spread your risk; green cells offset each other. All Days uses every day; Portfolio Down-Days uses only the days the whole portfolio lost money, which is when spreading risk matters most.
- Per-Strategy Equity Curves: each member’s P&L over time, on one chart.
- What-if: untick a member or change its lots to see the combined P&L, drawdown, RMDD and win rate again, on the same costs and days as the figures above. With every member on at 1× it shows the same numbers as the headline. Run these lots backtests the basket at those lots, with the same period, DTE filters and basket limits, as a new report. A run with a Basket SL or Basket target shows no scaled figures and no optimizer: at other lots the basket reaches its limits at other minutes, so only a run of the mix gives its result.
Example: a cell of 0.85 between two members means they made and lost money on mostly the same days. Holding both is close to holding one of them twice.
Read the rest of the report as on Reading your results.
Compare portfolios
Section titled “Compare portfolios”- Tick the box beside two or more portfolios (of either kind), up to 10.
- A bar appears at the bottom. Set From, To and Underlyings if needed.
- It shows the cost before you run: one backtest per portfolio, at one credit (two if a strategy in it uses indicators).
- Click COMPARE n PORTFOLIOS.
A portfolio with no strategy that can run is left out, and the bar says which.
The result has three parts:
- Portfolio Comparison: one row per portfolio with the same measures as Strategy Comparison above, plus a pinned COMBINED (all selected) row: all the chosen portfolios run together. Every figure is after government charges, so a row matches that portfolio’s own report. A run with more than 50,000 trades keeps only part of its trade log and cannot be re-costed; its row is marked before charges. Click a column to rank by it.
- An equity chart with each portfolio’s P&L over time, and the combined line.
- Full Backtest Report under each portfolio: its complete report, opened on demand.
If a portfolio’s run produced nothing, a note says how many were left out of every panel.
Example: you compare Index iron condors and Morning breakouts over the same three months. The first made ₹70,000 with a ₹40,000 drawdown, the second ₹45,000 with ₹30,000. The COMBINED row shows ₹1,15,000 with a drawdown of only ₹42,000, because the two lost money on different days. Together they are better than either alone.
A strategy that was deleted from the Armory shows as Unknown Strategy in an assembled portfolio. Edit the portfolio and untick it.