Indicator strategies
An indicator strategy enters when a chart condition becomes true, for example “RSI crosses above 50”, instead of at a fixed time.
Where to find it: Strategy Builder → the Indicator / Signal-Driven card.
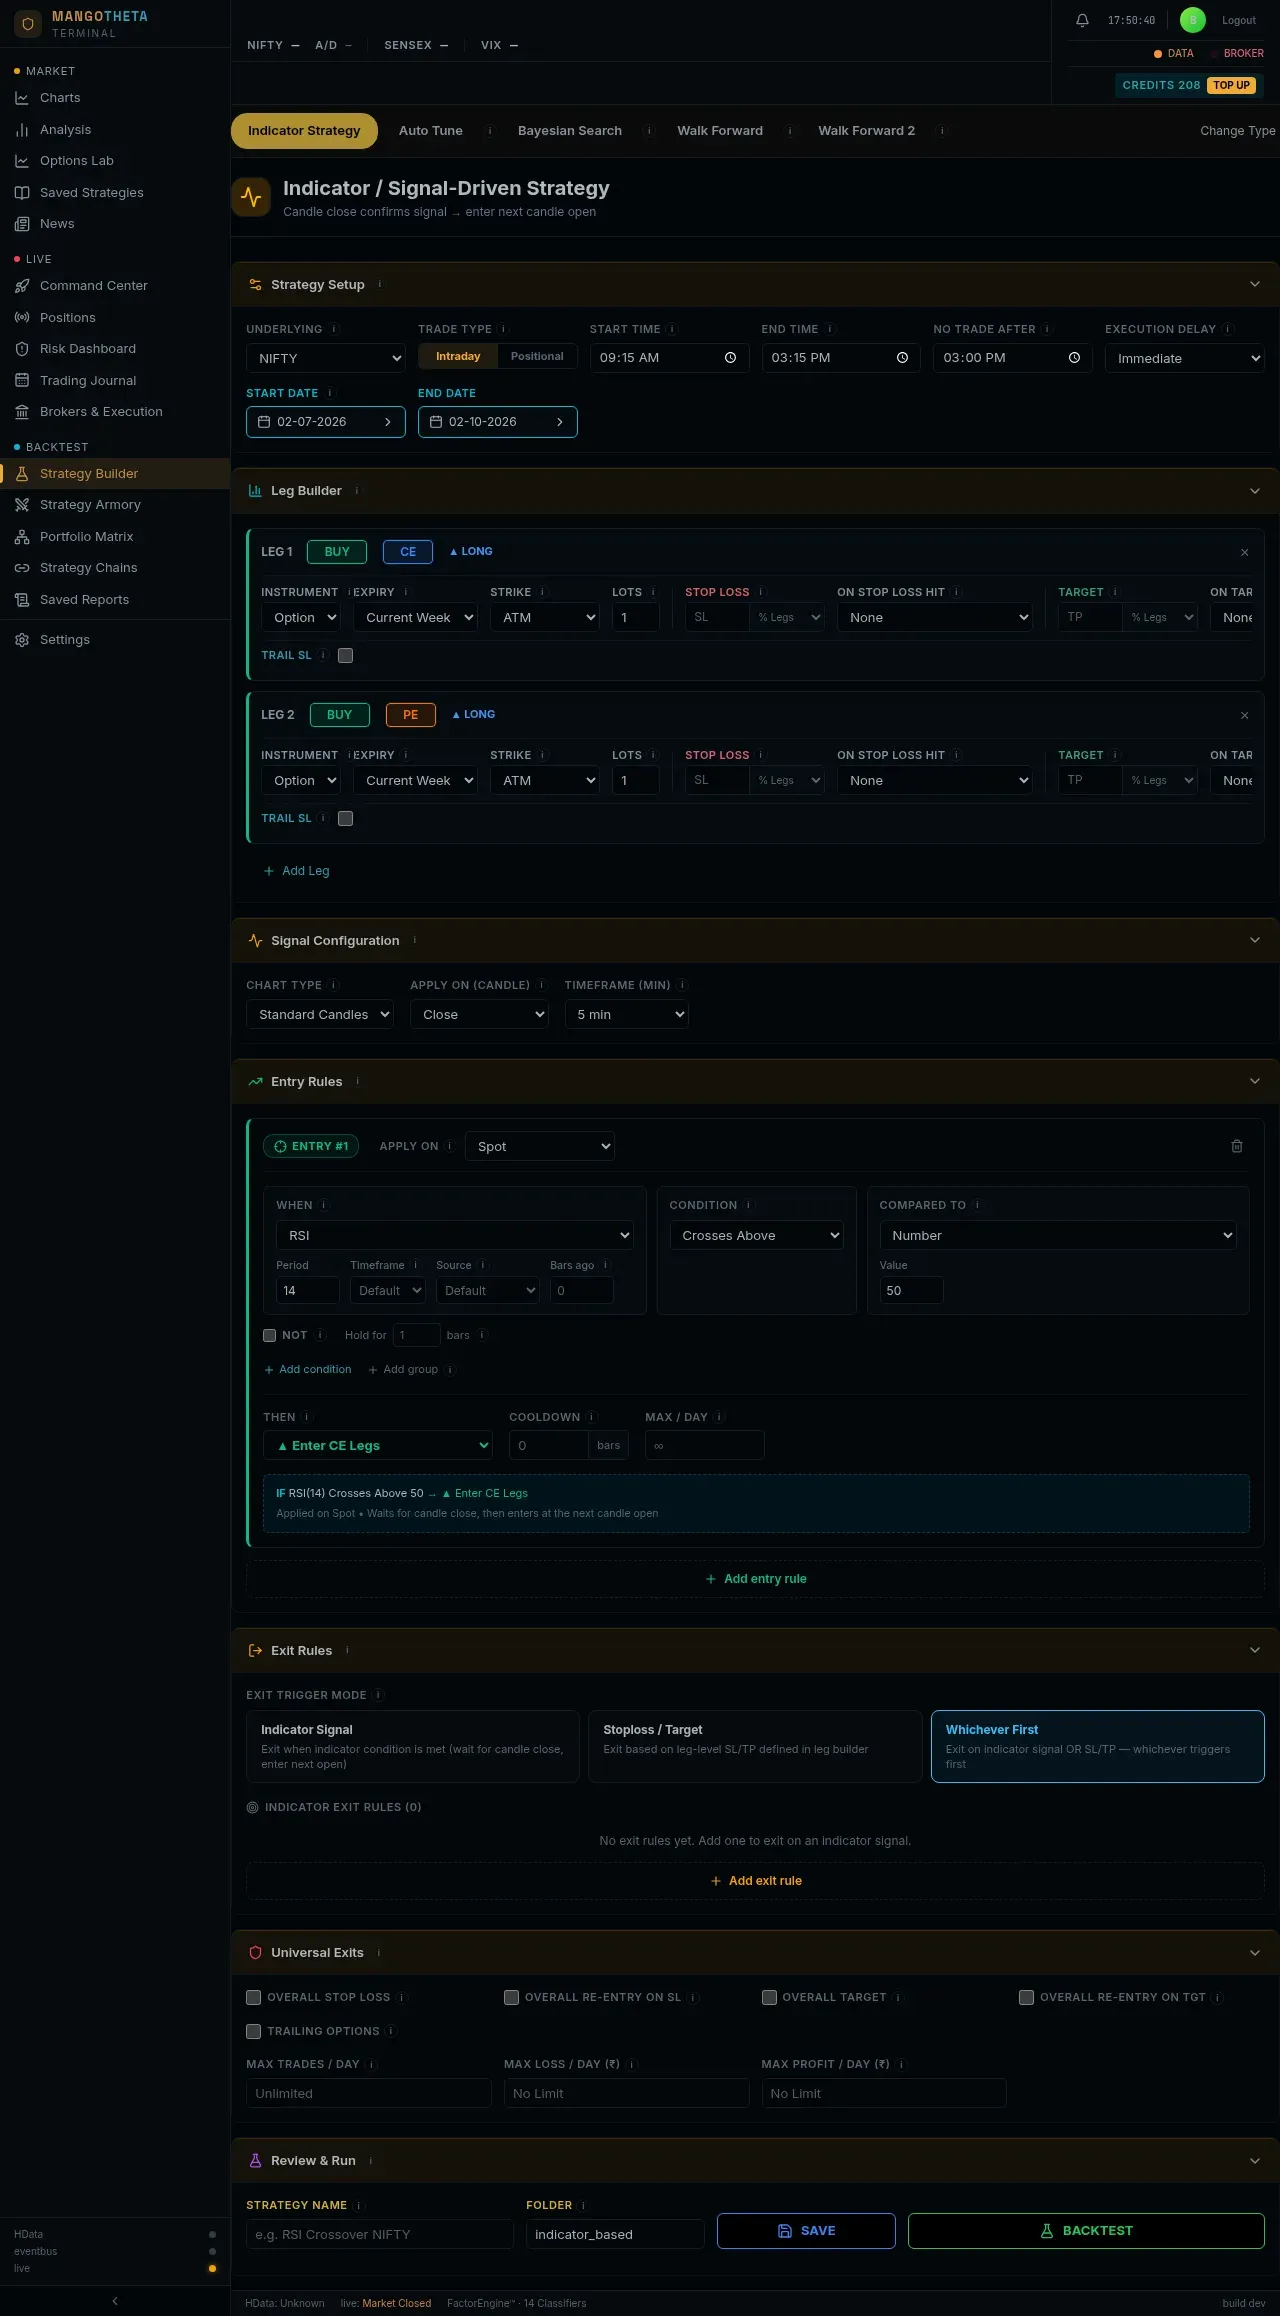
The form has seven sections. Sections 1, 2, 6 and 7 work like the time-based builder, so this page explains what is different. For the rest, see the Strategy Builder page.
How an indicator strategy runs
Section titled “How an indicator strategy runs”- The app builds candles of the size you choose (for example 5 minutes).
- When a candle closes, it checks your entry and exit rules on that candle.
- If a rule is true, the action happens at the start of the next minute.
So a rule can only fire once per candle, and it never uses a candle that has not finished.
1. Strategy Setup
Section titled “1. Strategy Setup”Same as the time-based builder, except the timing fields:
| Field | What it does | Starts at |
|---|---|---|
| Start Time | The earliest time a rule may fire. Indicators are still worked out before it. | 09:15 |
| End Time | Anything still open is closed at this time. | 15:15 |
| No Trade After | After this time a rule that fires does not open a new position. | 15:00 |
| Execution Delay | Wait this long after the rule fires before entering. If an exit rule fires during the wait, the entry is cancelled. | Immediate |
Example: Start Time 09:30, No Trade After 14:30, End Time 15:15. A rule that fires at 09:20 does nothing (too early). One at 11:05 opens a position. One at 14:45 does nothing (too late). Anything still open is closed at 15:15. With Execution Delay set to 2 minutes, the 11:05 signal enters at 11:07, unless an exit rule fires at 11:06.
2. Leg Builder
Section titled “2. Leg Builder”The legs work like the time-based leg builder, with these differences:
- A new indicator strategy starts with BUY CE ATM and BUY PE ATM (bought, not sold).
- There is no Wait & Trade: the rule itself decides when to enter.
- On Target Hit also offers Pyramiding. Instead of closing at the target, the leg stays open, and one more copy of it opens at the next minute: you add to the winning position. Strategies that use it run on the slower backtest engine.
Which legs a rule opens depends on its Then setting (below): a rule set to Enter CE Legs opens only your CE legs.
Example of Pyramiding: you buy the 24,000 CE at ₹100 with Target 20 (% legs) and On Target Hit set to Pyramiding. At ₹120 the target is reached: instead of selling, the app keeps the first lot and buys one more at the next minute. You now hold two lots, the second bought near ₹120.
3. Signal Configuration
Section titled “3. Signal Configuration”How the candles are built.
| Field | What it does | Starts at |
|---|---|---|
| Chart Type | Standard Candles, or Heikin Ashi (each candle averaged with the one before; smoother, but slower to react). | Standard Candles |
| Apply On (Candle) | Which price inside each candle indicators read: Close, Open, High, Low, HL2, HLC3, OHLC4. | Close |
| Timeframe (min) | Candle size, from 1 to 75 minutes. | 5 |
Example: with a 5-minute timeframe, the 09:15 candle covers 09:15 to 09:20.
4. Entry Rules
Section titled “4. Entry Rules”A new strategy starts with one rule: RSI (14) Crosses Above 50, on Spot, Then: ▲ Enter CE Legs. Change it to your own idea, or add more rules with Add entry rule.
Each rule has:
| Part | What it does |
|---|---|
| Apply On | The price series the rule reads: Spot (the index), Futures, CE Premium or PE Premium. For CE Premium and PE Premium, a Premium Tracking box picks which contract: Day Locked (9:15 ATM) follows the contract that was at the money at 9:15, all day (the default); Open Position (Trade Locked) follows the contract the strategy holds now. |
| Conditions | One or more comparisons. See below. |
| AND / OR | AND: all conditions must be true on the same candle. OR: any one is enough. |
| Then | What happens when the rule fires: ▲ Enter CE Legs, ▼ Enter PE Legs, ⇈ Enter All Legs, ▲ Enter CE & ✕ Exit PE, ▼ Enter PE & ✕ Exit CE, ▲ Enter FUT Long & ✕ Exit Short, ▼ Enter FUT Short & ✕ Exit Long. |
| Cooldown | The least number of candles between two firings of this rule. |
| Max / Day | The most times this rule may fire in a day. |
Under each rule, a line spells it out in words. Read it to check the rule says what you meant.
Example: you want to buy a call when the call’s own price breaks out. Apply On: CE Premium, Premium Tracking: Day Locked (9:15 ATM). Condition: Close Crosses Above EMA (20). Then: ▲ Enter CE Legs. The rule now watches the candles of the call that was at the money at 9:15, not the index.
A condition
Section titled “A condition”A condition compares a left term with a right term using an operator.
Terms. Any indicator from the list below, or Number (a fixed value). Click a term’s settings to change its period and other values. Extra settings appear where they apply:
| Setting | What it does |
|---|---|
| Timeframe | Work out this term on a different candle size from the rest of the rule (leave on Default to use the strategy’s). |
| Source | Read this term from a different price series than the rule’s Apply On. |
| Bars ago | Use the value from that many candles back. Close (Bars ago 5) on 5-minute candles is the close 25 minutes ago. |
| Offset | Add a fixed amount to a price level. Prev Day High + 20 means “20 points above yesterday’s high”. |
Operators.
| Operator | True when |
|---|---|
| Crosses Above / Crosses Below | The left term moves from below to above (or above to below) the right term on this candle. Fires once, on the crossing candle. |
| Crosses | Either of the two. |
| Greater Than, Less Than, Greater Than or Equal, Less Than or Equal, Equal To, Not Equal To | The comparison is true on this candle. Stays true for as long as it holds. |
| Between / Not Between | The left term is inside (or outside) a range; a second right-hand term gives the upper end. RSI (14) Between 40 and 60 is true while RSI is anywhere from 40 to 60. |
| Rising / Falling | The term is higher (or lower) than it was Over N bars ago. |
| Slope Above / Slope Below | The term’s average change per candle over N bars is above (or below) a threshold. |
Two more switches on each condition:
- NOT: turns the condition around: true exactly when it would be false.
- Hold for N bars: the condition must be true for N candles in a row before it counts. “RSI above 60, hold for 3 bars” ignores a single candle that pokes above 60 and falls back.
Groups. Add group puts several conditions in brackets with their own AND/OR, so one rule can say “(A and B) or C”. Numbers inside a group cannot be tuned in Auto Tune.
The indicators
Section titled “The indicators”| Group | Indicators |
|---|---|
| Price | Close, Open, High, Low, HL2, HLC3, OHLC4, Typical Price, Median Price, Weighted Close |
| Trend | SMA, EMA, WMA, DEMA, TEMA, HMA, T3, TRIMA, RMA, VWAP, VWMA, Supertrend, Supertrend Direction, Kalman, Ichimoku (Tenkan, Kijun, Senkou A, Senkou B), Parabolic SAR, MACD Line, ADX, ADXR, +DI, −DI |
| Momentum | RSI, Stochastic %K and %D, Williams %R, CCI, ROC, Momentum, MFI, MACD Signal, MACD Histogram, Aroon Up/Down/Oscillator, BOP, TRIX, DX |
| Volatility | Bollinger Upper/Middle/Lower, Bollinger %B, Bollinger Width, ATR, NATR, ATR %, True Range, Keltner Upper/Middle/Lower, Donchian Upper/Lower/Mid, Std Dev, Squeeze, Z-Score |
| Volume | OBV, OBV SMA, CMF, AD Line, AD Oscillator, Volume SMA, Volume Profile POC/VAH/VAL |
| Patterns / Breakouts | NR4, NR5, NR7, Inside Bar, Doji, Hammer, Inverted Hammer, Marubozu, Engulfing, Dragonfly Doji, Gravestone Doji, Long Shadow |
| Session Levels | Prev Day High/Low/Close, Prev Day POC/VAH/VAL, Week High/Low, Pivot PP, R1–R3, S1–S3, ORB High/Low |
| Quant | Hurst Exponent |
| Value | Number |
5. Exit Rules
Section titled “5. Exit Rules”First pick the Exit Trigger Mode:
| Mode | Positions close on |
|---|---|
| Indicator Signal | Exit rules only. There is no stop loss: if the exit rule never fires, the position runs until the end time. |
| Stoploss / Target | The legs’ own stop loss and target only. No exit rules. |
| Whichever First | An exit rule or a leg’s stop loss / target, whichever comes first. This is the default and the safest choice. |
Exit rules are built like entry rules. Their Then choices are ✕ Exit CE Legs, ✕ Exit PE Legs, ✕ Exit FUT Legs and ⇊ Exit All Legs.
6. Universal Exits and 7. Review & Run
Section titled “6. Universal Exits and 7. Review & Run”The same as the time-based builder, with fewer options: Overall Stop Loss, Overall Re-entry on SL, Overall Target, Overall Re-entry on Tgt, Trailing Options, Max Trades / Day, Max Loss / Day (₹) and Max Profit / Day (₹). In the re-entry choices, Min means “after N minutes” and Next Candle means “when the combined premium is back at its starting level”.
Worked examples
Section titled “Worked examples”1. RSI crossing up buys a call
Section titled “1. RSI crossing up buys a call”- Apply On: Spot. Condition: RSI (14) Crosses Above Number 50. Then: ▲ Enter CE Legs.
- Legs: BUY CE ATM, 1 lot, Stop Loss 30 (% legs), Target 60 (% legs).
- Exit Trigger Mode: Whichever First.
On 5-minute candles: the 10:00–10:05 candle closes with RSI at 52, after 48 on the candle before. The rule fires, and the CE is bought at the start of 10:05. It then closes when its price falls 30%, rises 60%, or at 15:15.
2. Two things true together
Section titled “2. Two things true together”- One rule, AND: Close Crosses Above EMA (20), and RSI (14) Greater Than 55.
- Then: ▲ Enter CE Legs.
The rule fires only on a candle where the close crosses above the 20-period EMA and RSI is above 55 on that same candle. A cross while RSI is 50 does nothing.
3. Exit on a Supertrend flip
Section titled “3. Exit on a Supertrend flip”- Exit Trigger Mode: Whichever First.
- Exit rule: Supertrend Direction (10, 3) Crosses Below Number 0. Then: ⇊ Exit All Legs.
When Supertrend turns down, all legs close at the next minute, unless a leg’s stop loss or target closed it first.